33
/it/
AIzaSyAYiBZKx7MnpbEhh9jyipgxe19OcubqV5w
August 1, 2025
30828
Europe & Central Asia
ECS
false
2
1
Labor force with secondary education (% of total)
2015,2014,2013,2012,2011,2010,2009,2008,2007,2006,2005,2004,2003,1997,1996,1995
Download
Biblioteca di statistiche globali →Europe & Central Asia →

Labor force with secondary education (% of total)

Queste statistiche in altri paesi:

AlbaniaAlgeriaAntigua and BarbudaArgentinaArmeniaArubaAustraliaAustriaAzerbaijanBahamas, TheBahrainBarbadosBelarusBelgiumBelizeBermudaBoliviaBosnia and HerzegovinaBotswanaBrazilBritish Virgin IslandsBulgariaCambodiaCanadaCayman IslandsCentral Europe and the BalticsChadChileColombiaCosta RicaCroatiaCubaCyprusCzech RepublicDenmarkDominicaDominican RepublicEarly-demographic dividendEcuadorEgypt, Arab Rep.El SalvadorEstoniaEthiopiaEuro areaEurope & Central AsiaEurope & Central Asia (excluding high income)Europe & Central Asia (IDA & IBRD countries)European UnionFinlandFranceFrench PolynesiaGeorgiaGermanyGhanaGreeceGuatemalaGuyanaHigh incomeHondurasHong Kong SAR, ChinaHungaryIcelandIndiaIndonesiaIran, Islamic Rep.IrelandIsraelItalyJapanJordanKazakhstanKorea, Rep.KosovoKuwaitKyrgyz RepublicLatin America & Caribbean Latin America & Caribbean (excluding high income)Latin America & the Caribbean (IDA & IBRD countries)LatviaLebanonLithuaniaLuxembourgMacao SAR, ChinaMacedonia, FYRMadagascarMalaysiaMaltaMauritiusMexicoMoldovaMongoliaMontenegroMoroccoNamibiaNepalNetherlandsNew CaledoniaNew ZealandNicaraguaNigerNigeriaNorth AmericaNorwayOECD membersOmanPakistanPanamaParaguayPeruPhilippinesPolandPortugalPost-demographic dividendRomaniaRussian FederationRwandaSan MarinoSaudi ArabiaSerbiaSingaporeSlovak RepublicSloveniaSouth AfricaSouth AsiaSouth Asia (IDA & IBRD)SpainSri LankaSt. Kitts and NevisSt. LuciaSt. Vincent and the GrenadinesSwedenSwitzerlandSyrian Arab RepublicTajikistanThailandTimor-LesteTrinidad and TobagoTunisiaTurkeyUgandaUkraineUnited Arab EmiratesUnited KingdomUnited StatesUruguayVenezuela, RBWest Bank and GazaYemen, Rep.

Linea del tempo:

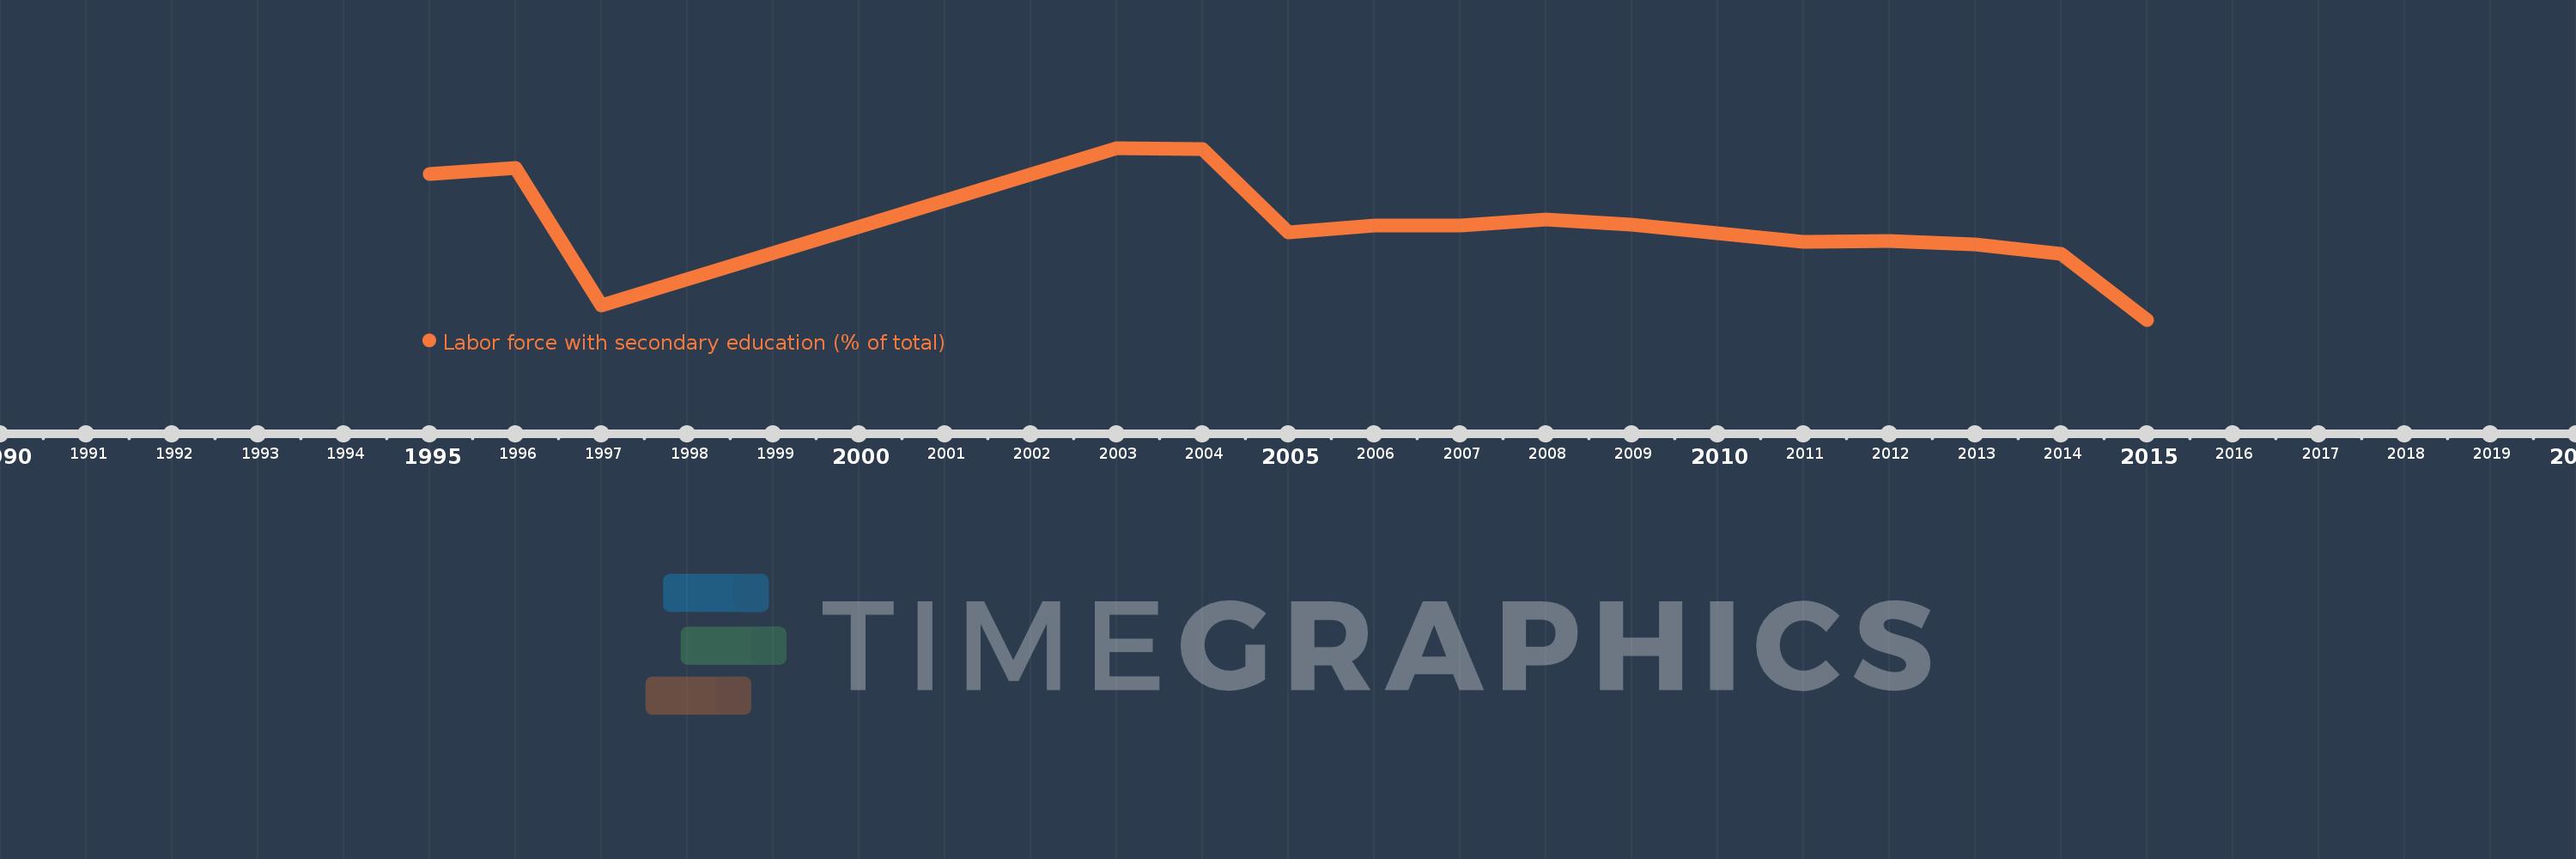
Questa scala temporale mostra un grafico dal 1995 anno al 2015 anno. Europe & Central Asia. I dati fino ad 1994 anno non disponibili. Il numero di osservazioni attuali secondo i date: 16.

La fonte (nome):

Indicatori dello sviluppo mondiale

La fonte (organizzazione):

International Labour Organization, Key Indicators of the Labour Market database.

Categorie:

Education, Social Protection & Labor

sono stati aggiornati

23 apr 2017 anni

Indicatori delle variazioni dei valori per anni

In media:
47.254
Minima:
42.016
1 gen 2015 anni
Massimo:
51.548
1 gen 2003 anni
Alla data di osservazione
Valore
Variazione assoluta
La variazione rispetto al valore precedente
1 gen 1995 anni
50.107
+50.107
0.0%
1 gen 1996 anni
50.461
+0.354
0.71%
1 gen 1997 anni
42.797
-7.664
-15.19%
1 gen 2003 anni
51.548
+8.751
20.45%
1 gen 2004 anni
51.486
-0.062
-0.12%
1 gen 2005 anni
46.847
-4.64
-9.01%
1 gen 2006 anni
47.249
+0.402
0.86%
1 gen 2007 anni
47.248
-0.001
0.0%
1 gen 2008 anni
47.561
+0.313
0.66%
1 gen 2009 anni
47.305
-0.255
-0.54%
1 gen 2010 anni
46.823
-0.482
-1.02%
1 gen 2011 anni
46.344
-0.479
-1.02%
1 gen 2012 anni
46.383
+0.039
0.08%
1 gen 2013 anni
46.213
-0.169
-0.36%
1 gen 2014 anni
45.679
-0.535
-1.16%
1 gen 2015 anni
42.016
-3.663
-8.02%

Classificazione dei paesi secondo i statistiche attuali per anni