33
/it/
AIzaSyAYiBZKx7MnpbEhh9jyipgxe19OcubqV5w
August 1, 2025
53039
OECD members
OED
false
2
1
Self-employed, male (% of male employment)
2014,2013,2012,2011,2010,2009,2008,2007,2006,2005,2004,2003,2002,2001,2000,1999,1998,1997,1996,1995,1994,1993,1992
Download
Biblioteca di statistiche globali →OECD members →

Self-employed, male (% of male employment)

Queste statistiche in altri paesi:

AlbaniaAlgeriaAmerican SamoaAntigua and BarbudaArgentinaArmeniaArubaAustraliaAustriaAzerbaijanBahamas, TheBahrainBangladeshBarbadosBelarusBelgiumBelizeBeninBermudaBhutanBoliviaBosnia and HerzegovinaBotswanaBrazilBritish Virgin IslandsBrunei DarussalamBulgariaBurkina FasoBurundiCabo VerdeCambodiaCameroonCanadaCaribbean small statesCayman IslandsCentral Europe and the BalticsChadChileColombiaCongo, Rep.Costa RicaCote d'IvoireCroatiaCubaCyprusCzech RepublicDenmarkDjiboutiDominicaDominican RepublicEarly-demographic dividendEcuadorEgypt, Arab Rep.El SalvadorEquatorial GuineaEstoniaEthiopiaEuro areaEurope & Central AsiaEurope & Central Asia (excluding high income)Europe & Central Asia (IDA & IBRD countries)European UnionFijiFinlandFranceFrench PolynesiaGabonGambia, TheGeorgiaGermanyGhanaGreeceGrenadaGuatemalaGuineaGuyanaHaitiHigh incomeHondurasHong Kong SAR, ChinaHungaryIcelandIndiaIndonesiaIran, Islamic Rep.IrelandIsle of ManIsraelItalyJamaicaJapanJordanKazakhstanKenyaKiribatiKorea, Rep.KosovoKuwaitKyrgyz RepublicLao PDRLatin America & Caribbean Latin America & Caribbean (excluding high income)Latin America & the Caribbean (IDA & IBRD countries)LatviaLebanonLesothoLiberiaLithuaniaLower middle incomeLuxembourgMacao SAR, ChinaMacedonia, FYRMadagascarMalawiMalaysiaMaldivesMaliMaltaMarshall IslandsMauritiusMexicoMiddle East & North AfricaMiddle East & North Africa (excluding high income)Middle East & North Africa (IDA & IBRD countries)MoldovaMongoliaMontenegroMoroccoMozambiqueNamibiaNepalNetherlandsNew CaledoniaNew ZealandNicaraguaNigerNorth AmericaNorwayOECD membersOmanPakistanPanamaParaguayPeruPhilippinesPolandPortugalPost-demographic dividendPuerto RicoQatarRomaniaRussian FederationRwandaSamoaSan MarinoSao Tome and PrincipeSaudi ArabiaSenegalSerbiaSeychellesSierra LeoneSingaporeSlovak RepublicSloveniaSouth AfricaSouth AsiaSouth Asia (IDA & IBRD)SpainSri LankaSt. Kitts and NevisSt. LuciaSt. Vincent and the GrenadinesSurinameSwazilandSwedenSwitzerlandSyrian Arab RepublicTajikistanTanzaniaThailandTogoTongaTrinidad and TobagoTunisiaTurkeyTurks and Caicos IslandsTuvaluUgandaUkraineUnited Arab EmiratesUnited KingdomUnited StatesUruguayVanuatuVenezuela, RBVietnamWest Bank and GazaYemen, Rep.ZambiaZimbabwe

Linea del tempo:

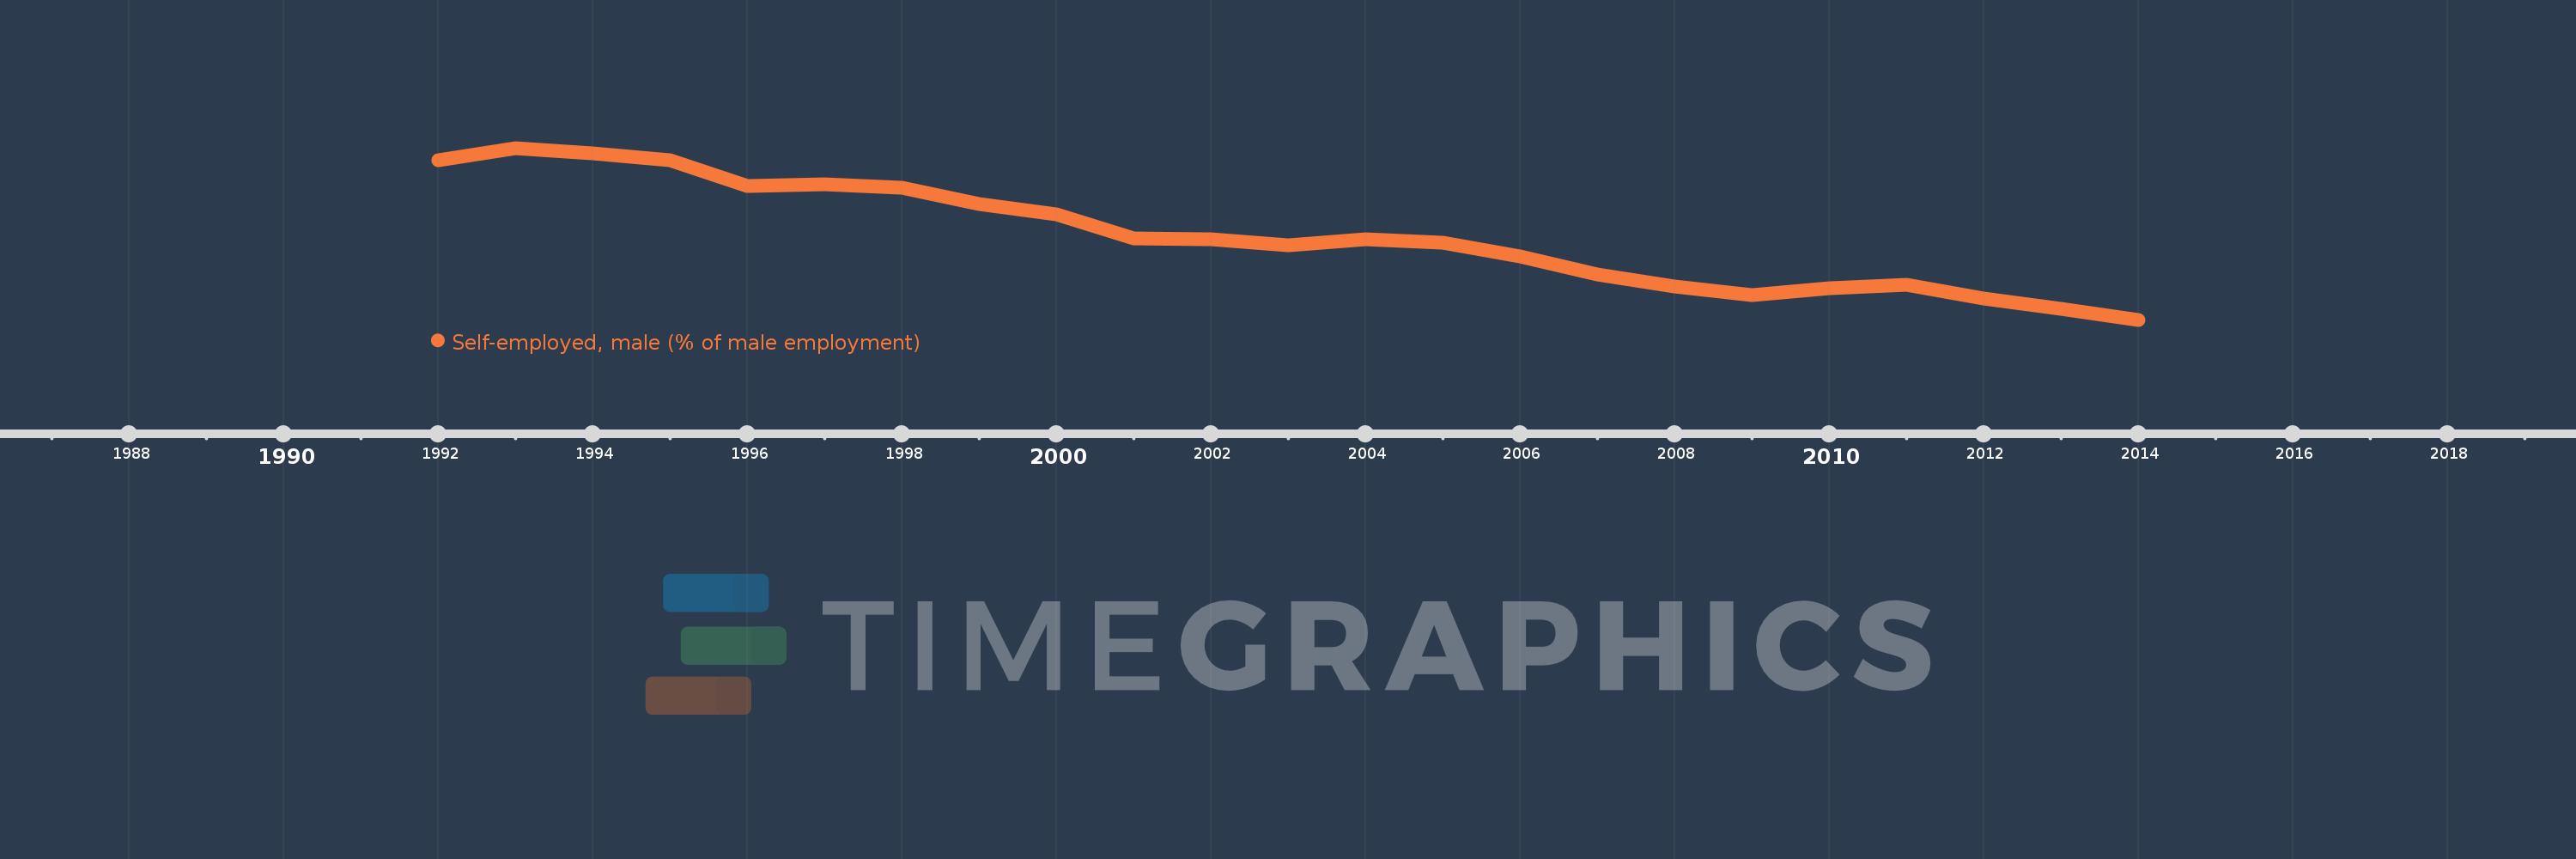
Questa scala temporale mostra un grafico dal 1992 anno al 2014 anno. OECD members. I dati fino ad 1991 anno non disponibili. Il numero di osservazioni attuali secondo i date: 23.

La fonte (nome):

Indicatori dello sviluppo mondiale

La fonte (organizzazione):

International Labour Organization, Key Indicators of the Labour Market database.

Categorie:

Social Protection & Labor, Gender

sono stati aggiornati

23 apr 2017 anni

Indicatori delle variazioni dei valori per anni

In media:
19.668
Minima:
17.704
1 gen 2014 anni
Massimo:
21.706
1 gen 1993 anni
Alla data di osservazione
Valore
Variazione assoluta
La variazione rispetto al valore precedente
1 gen 1992 anni
21.429
+21.429
0.0%
1 gen 1993 anni
21.706
+0.277
1.29%
1 gen 1994 anni
21.575
-0.132
-0.61%
1 gen 1995 anni
21.426
-0.149
-0.69%
1 gen 1996 anni
20.819
-0.607
-2.83%
1 gen 1997 anni
20.861
+0.042
0.2%
1 gen 1998 anni
20.775
-0.086
-0.41%
1 gen 1999 anni
20.392
-0.383
-1.85%
1 gen 2000 anni
20.163
-0.229
-1.12%
1 gen 2001 anni
19.6
-0.563
-2.79%
1 gen 2002 anni
19.588
-0.012
-0.06%
1 gen 2003 anni
19.441
-0.147
-0.75%
1 gen 2004 anni
19.585
+0.144
0.74%
1 gen 2005 anni
19.498
-0.087
-0.44%
1 gen 2006 anni
19.185
-0.314
-1.61%
1 gen 2007 anni
18.764
-0.421
-2.2%
1 gen 2008 anni
18.479
-0.285
-1.52%
1 gen 2009 anni
18.269
-0.21
-1.14%
1 gen 2010 anni
18.431
+0.163
0.89%
1 gen 2011 anni
18.522
+0.09
0.49%
1 gen 2012 anni
18.201
-0.32
-1.73%
1 gen 2013 anni
17.959
-0.242
-1.33%
1 gen 2014 anni
17.704
-0.256
-1.42%

Classificazione dei paesi secondo i statistiche attuali per anni