33
/it/
AIzaSyAYiBZKx7MnpbEhh9jyipgxe19OcubqV5w
August 1, 2025
52245
North America
NAC
false
2
1
Self-employed, male (% of male employment)
2014,2013,2012,2011,2010,2009,2008,2007,2006,2005,2004,2003,2002,2001,2000,1999,1998,1997,1996,1995,1994,1993,1992
Download
Biblioteca di statistiche globali →North America →

Self-employed, male (% of male employment)

Queste statistiche in altri paesi:

AlbaniaAlgeriaAmerican SamoaAntigua and BarbudaArgentinaArmeniaArubaAustraliaAustriaAzerbaijanBahamas, TheBahrainBangladeshBarbadosBelarusBelgiumBelizeBeninBermudaBhutanBoliviaBosnia and HerzegovinaBotswanaBrazilBritish Virgin IslandsBrunei DarussalamBulgariaBurkina FasoBurundiCabo VerdeCambodiaCameroonCanadaCaribbean small statesCayman IslandsCentral Europe and the BalticsChadChileColombiaCongo, Rep.Costa RicaCote d'IvoireCroatiaCubaCyprusCzech RepublicDenmarkDjiboutiDominicaDominican RepublicEarly-demographic dividendEcuadorEgypt, Arab Rep.El SalvadorEquatorial GuineaEstoniaEthiopiaEuro areaEurope & Central AsiaEurope & Central Asia (excluding high income)Europe & Central Asia (IDA & IBRD countries)European UnionFijiFinlandFranceFrench PolynesiaGabonGambia, TheGeorgiaGermanyGhanaGreeceGrenadaGuatemalaGuineaGuyanaHaitiHigh incomeHondurasHong Kong SAR, ChinaHungaryIcelandIndiaIndonesiaIran, Islamic Rep.IrelandIsle of ManIsraelItalyJamaicaJapanJordanKazakhstanKenyaKiribatiKorea, Rep.KosovoKuwaitKyrgyz RepublicLao PDRLatin America & Caribbean Latin America & Caribbean (excluding high income)Latin America & the Caribbean (IDA & IBRD countries)LatviaLebanonLesothoLiberiaLithuaniaLower middle incomeLuxembourgMacao SAR, ChinaMacedonia, FYRMadagascarMalawiMalaysiaMaldivesMaliMaltaMarshall IslandsMauritiusMexicoMiddle East & North AfricaMiddle East & North Africa (excluding high income)Middle East & North Africa (IDA & IBRD countries)MoldovaMongoliaMontenegroMoroccoMozambiqueNamibiaNepalNetherlandsNew CaledoniaNew ZealandNicaraguaNigerNorth AmericaNorwayOECD membersOmanPakistanPanamaParaguayPeruPhilippinesPolandPortugalPost-demographic dividendPuerto RicoQatarRomaniaRussian FederationRwandaSamoaSan MarinoSao Tome and PrincipeSaudi ArabiaSenegalSerbiaSeychellesSierra LeoneSingaporeSlovak RepublicSloveniaSouth AfricaSouth AsiaSouth Asia (IDA & IBRD)SpainSri LankaSt. Kitts and NevisSt. LuciaSt. Vincent and the GrenadinesSurinameSwazilandSwedenSwitzerlandSyrian Arab RepublicTajikistanTanzaniaThailandTogoTongaTrinidad and TobagoTunisiaTurkeyTurks and Caicos IslandsTuvaluUgandaUkraineUnited Arab EmiratesUnited KingdomUnited StatesUruguayVanuatuVenezuela, RBVietnamWest Bank and GazaYemen, Rep.ZambiaZimbabwe

Linea del tempo:

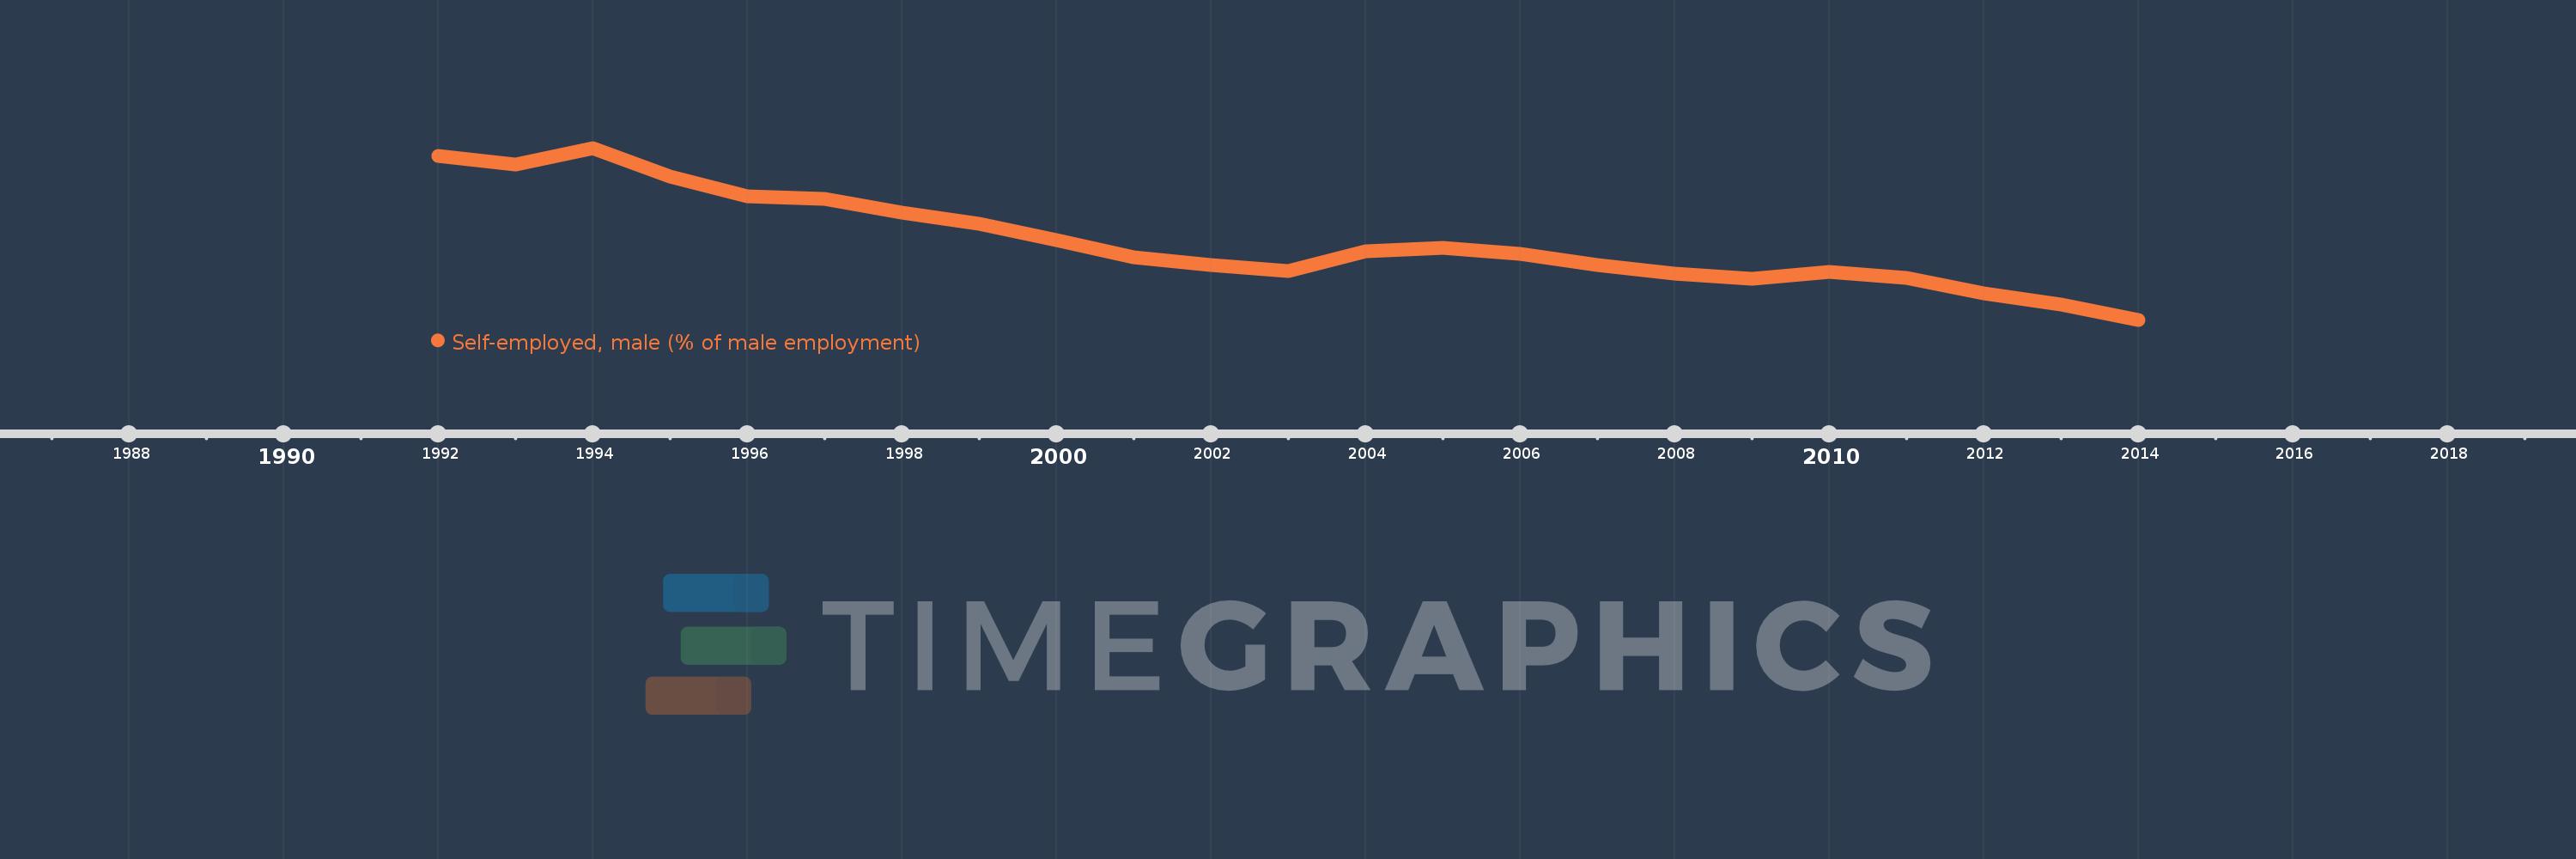
Questa scala temporale mostra un grafico dal 1992 anno al 2014 anno. North America. I dati fino ad 1991 anno non disponibili. Il numero di osservazioni attuali secondo i date: 23.

La fonte (nome):

Indicatori dello sviluppo mondiale

La fonte (organizzazione):

International Labour Organization, Key Indicators of the Labour Market database.

Categorie:

Social Protection & Labor, Gender

sono stati aggiornati

23 apr 2017 anni

Indicatori delle variazioni dei valori per anni

In media:
9.222
Minima:
7.713
1 gen 2014 anni
Massimo:
11.015
1 gen 1994 anni
Alla data di osservazione
Valore
Variazione assoluta
La variazione rispetto al valore precedente
1 gen 1992 anni
10.86
+10.86
0.0%
1 gen 1993 anni
10.697
-0.162
-1.5%
1 gen 1994 anni
11.015
+0.318
2.97%
1 gen 1995 anni
10.463
-0.552
-5.01%
1 gen 1996 anni
10.081
-0.382
-3.65%
1 gen 1997 anni
10.037
-0.044
-0.44%
1 gen 1998 anni
9.775
-0.262
-2.61%
1 gen 1999 anni
9.551
-0.224
-2.29%
1 gen 2000 anni
9.244
-0.307
-3.22%
1 gen 2001 anni
8.908
-0.336
-3.64%
1 gen 2002 anni
8.762
-0.146
-1.64%
1 gen 2003 anni
8.648
-0.114
-1.3%
1 gen 2004 anni
9.023
+0.375
4.34%
1 gen 2005 anni
9.092
+0.07
0.77%
1 gen 2006 anni
8.982
-0.111
-1.22%
1 gen 2007 anni
8.771
-0.211
-2.35%
1 gen 2008 anni
8.603
-0.168
-1.91%
1 gen 2009 anni
8.507
-0.096
-1.11%
1 gen 2010 anni
8.632
+0.124
1.46%
1 gen 2011 anni
8.514
-0.117
-1.36%
1 gen 2012 anni
8.215
-0.299
-3.52%
1 gen 2013 anni
8.003
-0.212
-2.58%
1 gen 2014 anni
7.713
-0.289
-3.62%

Classificazione dei paesi secondo i statistiche attuali per anni