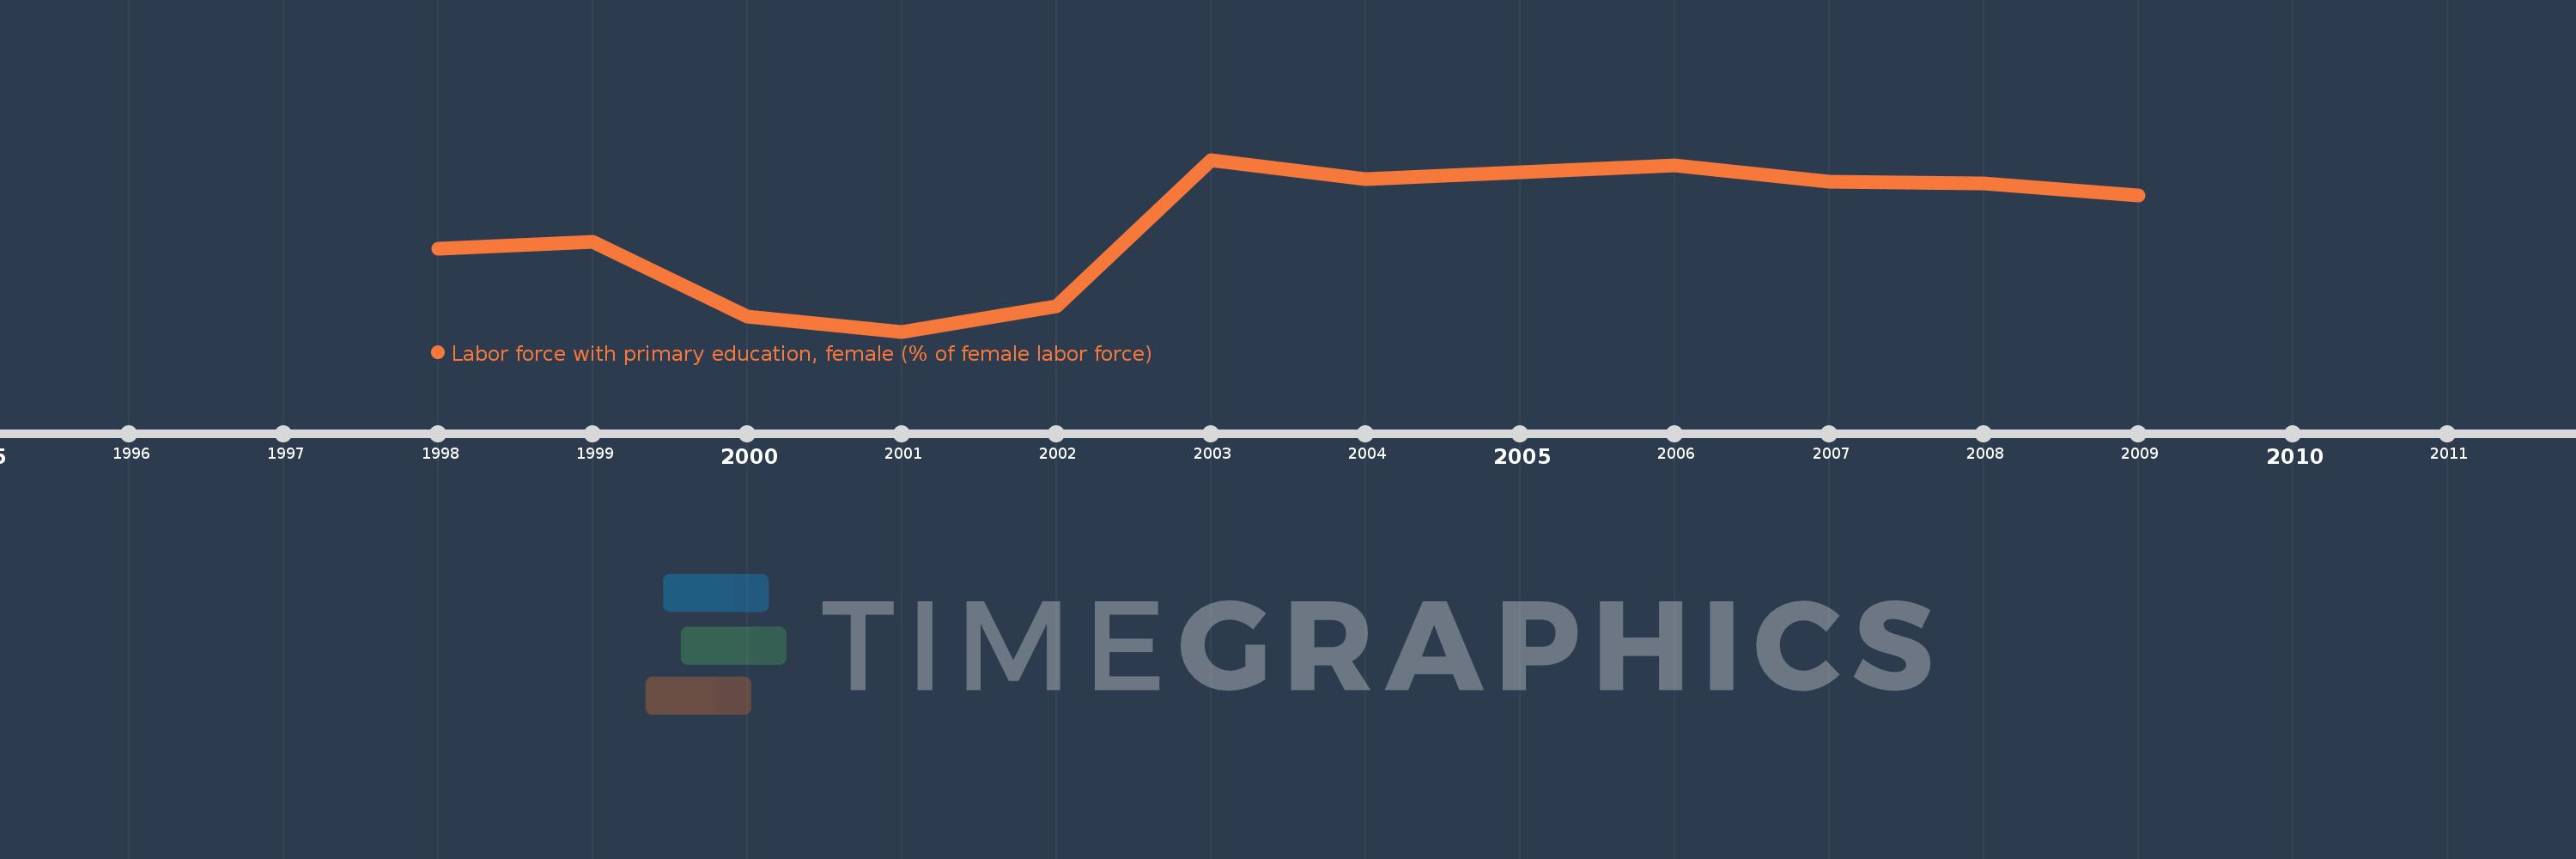
Questa scala temporale mostra un grafico dal 1998 anno al 2009 anno. OECD members. I dati fino ad 1997 anno non disponibili. Il numero di osservazioni attuali secondo i date: 11.
La fonte (nome):
Indicatori dello sviluppo mondiale
La fonte (organizzazione):
International Labour Organization, Key Indicators of the Labour Market database.
Categorie:
Education, Social Protection & Labor, Gender
sono stati aggiornati
23 apr 2017 anni
Indicatori delle variazioni dei valori per anni
In media:
28.086
Minima:
21.74
1 gen 2001 anni
Massimo:
32.287
1 gen 2003 anni
Alla data di osservazione
Valore
Variazione assoluta
La variazione rispetto al valore precedente
1 gen 1998 anni
26.806
+26.806
0.0%
1 gen 1999 anni
27.235
+0.428
1.6%
1 gen 2000 anni
22.666
-4.569
-16.77%
1 gen 2001 anni
21.74
-0.926
-4.08%
1 gen 2002 anni
23.274
+1.533
7.05%
1 gen 2003 anni
32.287
+9.014
38.73%
1 gen 2004 anni
31.084
-1.203
-3.73%
1 gen 2006 anni
31.94
+0.856
2.75%
1 gen 2007 anni
30.966
-0.974
-3.05%
1 gen 2008 anni
30.824
-0.142
-0.46%
1 gen 2009 anni
30.122
-0.702
-2.28%
Classificazione dei paesi secondo i statistiche attuali per anni