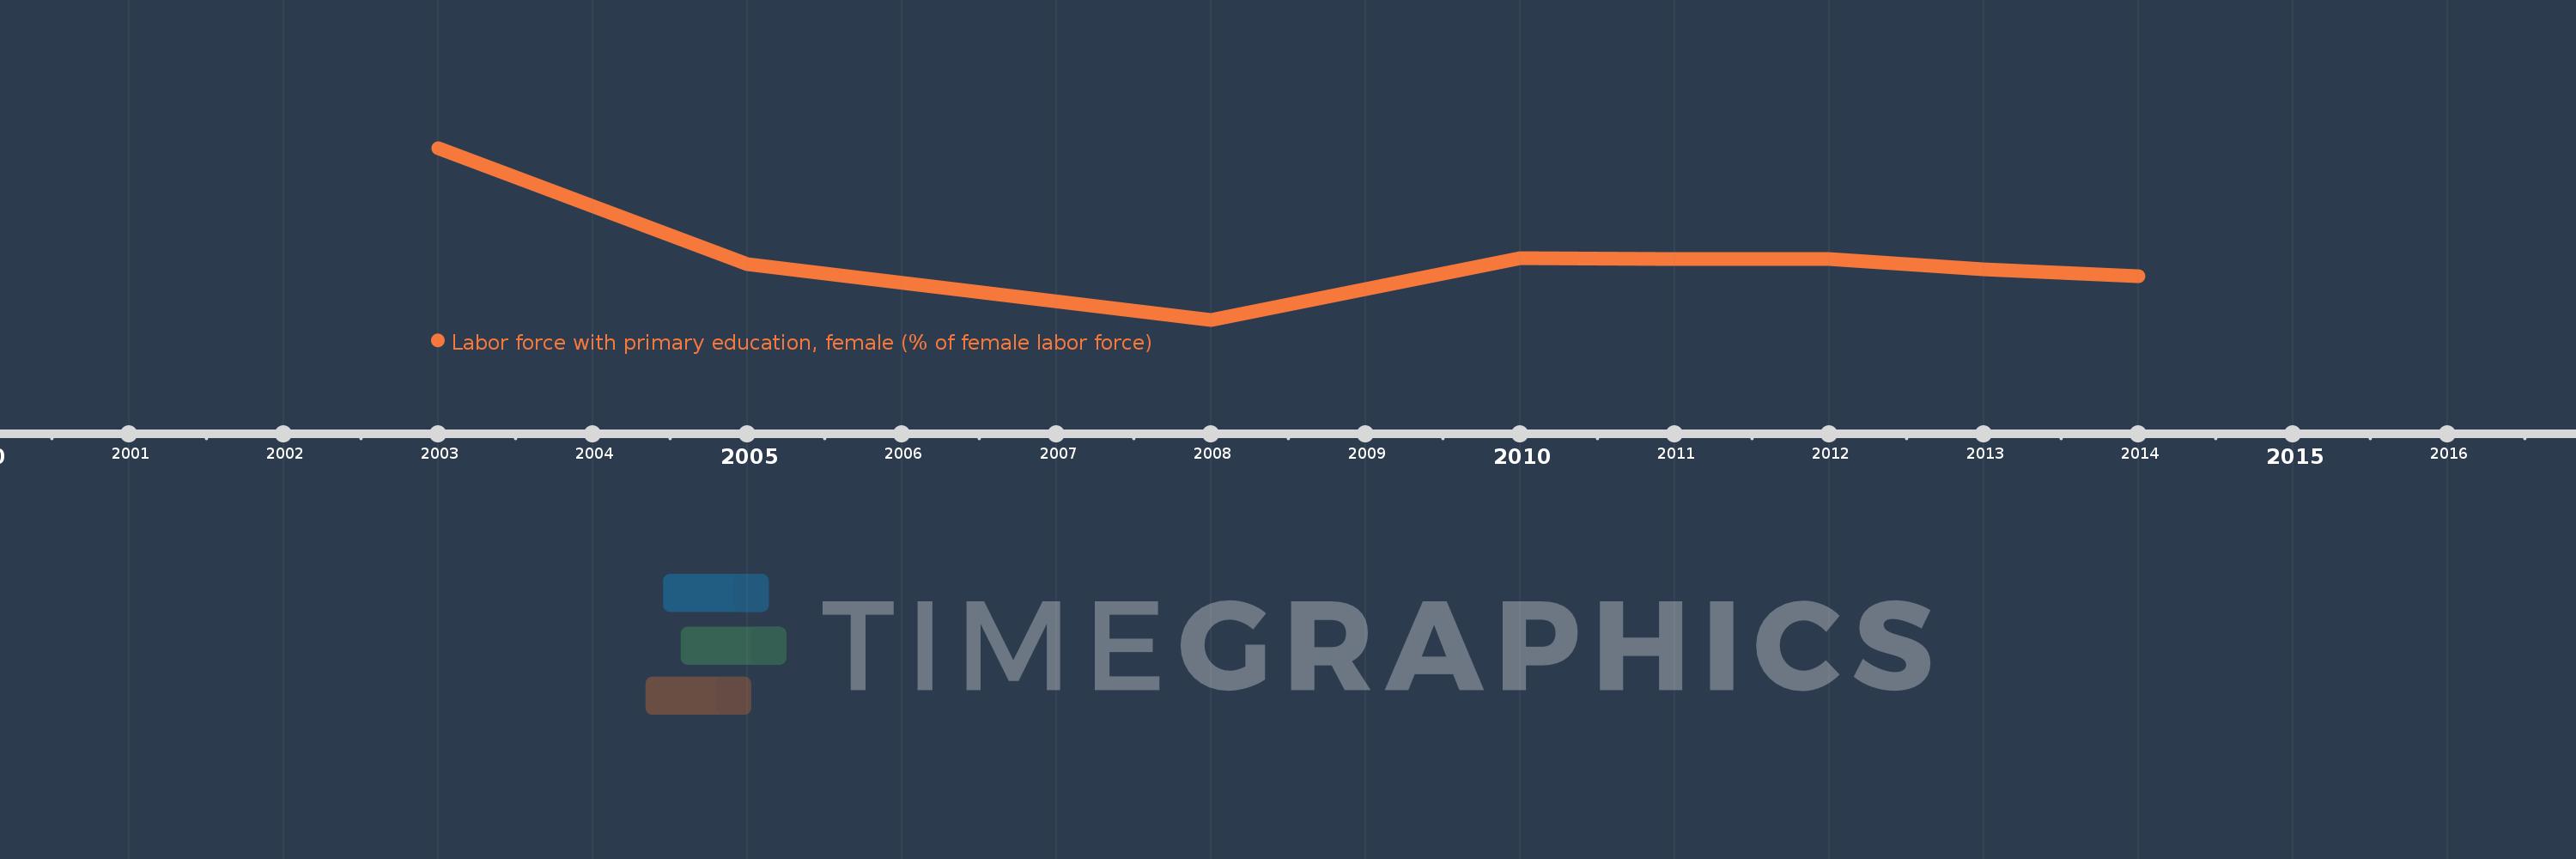
Questa scala temporale mostra un grafico dal 2003 anno al 2014 anno. Europe & Central Asia (excluding high income). I dati fino ad 2002 anno non disponibili. Il numero di osservazioni attuali secondo i date: 8.
La fonte (nome):
Indicatori dello sviluppo mondiale
La fonte (organizzazione):
International Labour Organization, Key Indicators of the Labour Market database.
Categorie:
Education, Social Protection & Labor, Gender
sono stati aggiornati
23 apr 2017 anni
Indicatori delle variazioni dei valori per anni
In media:
13.809
Minima:
11.972
1 gen 2008 anni
Massimo:
16.984
1 gen 2003 anni
Alla data di osservazione
Valore
Variazione assoluta
La variazione rispetto al valore precedente
1 gen 2003 anni
16.984
+16.984
0.0%
1 gen 2005 anni
13.589
-3.395
-19.99%
1 gen 2008 anni
11.972
-1.617
-11.9%
1 gen 2010 anni
13.762
+1.789
14.94%
1 gen 2011 anni
13.735
-0.027
-0.19%
1 gen 2012 anni
13.738
+0.003
0.02%
1 gen 2013 anni
13.436
-0.302
-2.2%
1 gen 2014 anni
13.254
-0.181
-1.35%
Classificazione dei paesi secondo i statistiche attuali per anni