29
/it/
it
AIzaSyAYiBZKx7MnpbEhh9jyipgxe19OcubqV5w
April 1, 2024
50921
Middle income
MIC
false
2
1
GNI (constant 2010 US$)
2016,2015,2014,2013,2012,2011,2010,2009,2008,2007,2006,2005,2004,2003,2002,2001,2000,1999,1998,1997,1996,1995,1994,1993,1992,1991
Download
Biblioteca di statistiche globali →Middle income →

GNI (constant 2010 US$)

Queste statistiche in altri paesi:
AfghanistanAlbaniaAlgeriaAndorraAngolaAntigua and BarbudaArab WorldArgentinaArmeniaAustraliaAustriaAzerbaijanBahamas, TheBahrainBangladeshBarbadosBelarusBelgiumBelizeBeninBermudaBhutanBoliviaBosnia and HerzegovinaBotswanaBrazilBrunei DarussalamBulgariaBurkina FasoBurundiCabo VerdeCambodiaCameroonCanadaCaribbean small statesCentral African RepublicCentral Europe and the BalticsChadChileChinaColombiaComorosCongo, Dem. Rep.Congo, Rep.Costa RicaCote d'IvoireCroatiaCubaCyprusCzech RepublicDenmarkDominicaDominican RepublicEarly-demographic dividendEast Asia & PacificEast Asia & Pacific (excluding high income)East Asia & Pacific (IDA & IBRD countries)EcuadorEgypt, Arab Rep.El SalvadorEquatorial GuineaEritreaEstoniaEthiopiaEuro areaEurope & Central AsiaEurope & Central Asia (excluding high income)Europe & Central Asia (IDA & IBRD countries)European UnionFaroe IslandsFijiFinlandFragile and conflict affected situationsFranceGabonGambia, TheGeorgiaGermanyGhanaGreeceGrenadaGuatemalaGuineaGuinea-BissauGuyanaHaitiHeavily indebted poor countries (HIPC)High incomeHondurasHong Kong SAR, ChinaHungaryIBRD onlyIcelandIDA & IBRD totalIDA blendIDA onlyIDA totalIndiaIndonesiaIran, Islamic Rep.IraqIrelandIsle of ManIsraelItalyJamaicaJapanJordanKazakhstanKenyaKiribatiKorea, Rep.KosovoKuwaitKyrgyz RepublicLao PDRLate-demographic dividendLatin America & Caribbean Latin America & Caribbean (excluding high income)Latin America & the Caribbean (IDA & IBRD countries)LatviaLeast developed countries: UN classificationLebanonLesothoLiberiaLibyaLiechtensteinLithuaniaLow & middle incomeLow incomeLower middle incomeLuxembourgMacao SAR, ChinaMacedonia, FYRMadagascarMalawiMalaysiaMaldivesMaliMaltaMarshall IslandsMauritaniaMauritiusMexicoMicronesia, Fed. Sts.Middle East & North AfricaMiddle East & North Africa (excluding high income)Middle East & North Africa (IDA & IBRD countries)Middle incomeMoldovaMongoliaMontenegroMoroccoMozambiqueMyanmarNamibiaNauruNepalNetherlandsNew ZealandNicaraguaNigerNigeriaNorth AmericaNorwayOECD membersOmanOther small statesPacific island small statesPakistanPalauPanamaPapua New GuineaParaguayPeruPhilippinesPolandPortugalPost-demographic dividendPre-demographic dividendPuerto RicoQatarRomaniaRussian FederationRwandaSamoaSao Tome and PrincipeSaudi ArabiaSenegalSerbiaSeychellesSierra LeoneSingaporeSlovak RepublicSloveniaSmall statesSolomon IslandsSouth AfricaSouth AsiaSouth Asia (IDA & IBRD)South SudanSpainSri LankaSt. Kitts and NevisSt. LuciaSt. Vincent and the GrenadinesSub-Saharan Africa Sub-Saharan Africa (excluding high income)Sub-Saharan Africa (IDA & IBRD countries)SudanSurinameSwazilandSwedenSwitzerlandTajikistanTanzaniaThailandTimor-LesteTogoTongaTrinidad and TobagoTunisiaTurkeyTurkmenistanTuvaluUgandaUkraineUnited Arab EmiratesUnited KingdomUnited StatesUpper middle incomeUruguayUzbekistanVanuatuVenezuela, RBVietnamWest Bank and GazaWorldYemen, Rep.ZambiaZimbabwe
Linea del tempo:
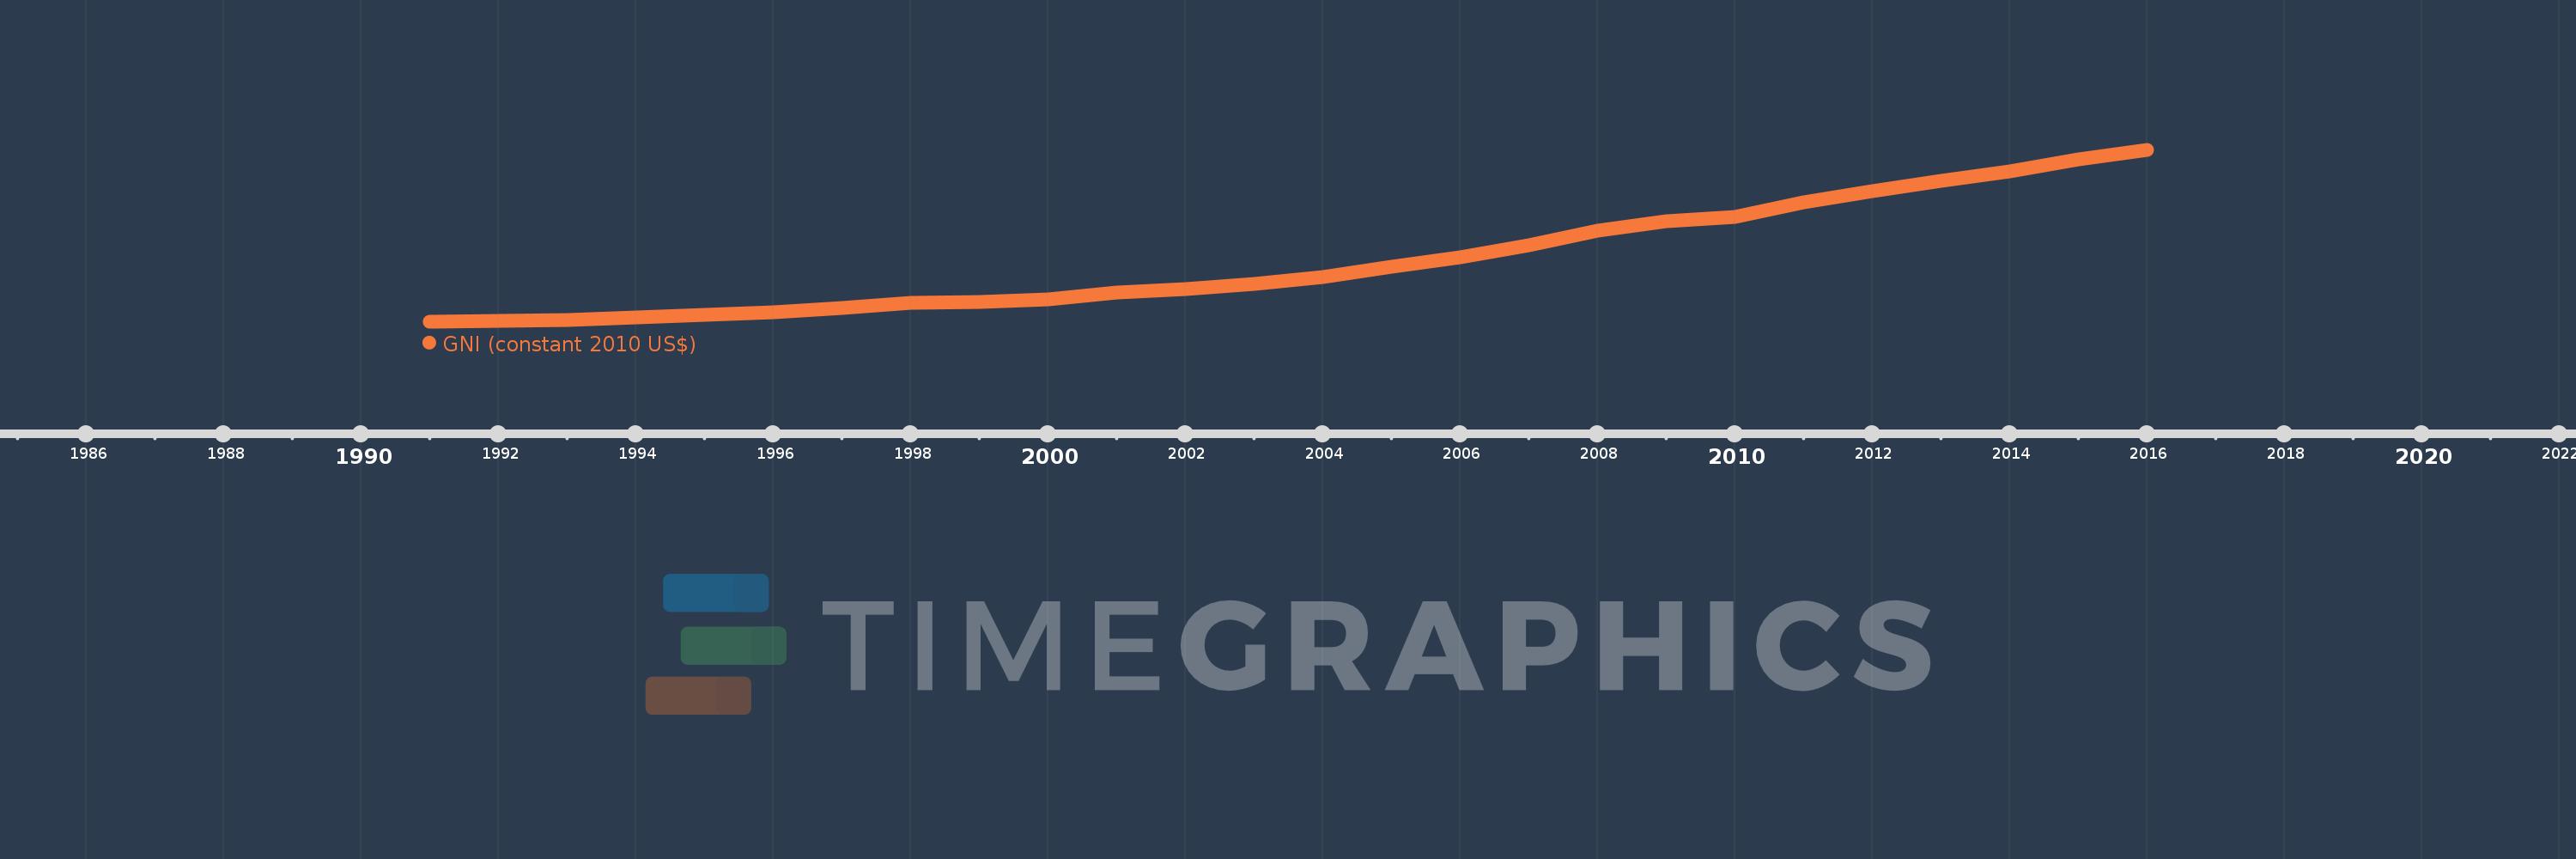
Questa scala temporale mostra un grafico dal 1991 anno al 2016 anno. Middle income. I dati fino ad 1990 anno non disponibili. Il numero di osservazioni attuali secondo i date: 26.
La fonte (nome):
Indicatori dello sviluppo mondiale
La fonte (organizzazione):
World Bank national accounts data, and OECD National Accounts data files.
Categorie:
Economy & Growth
sono stati aggiornati
23 apr 2017 anni
Indicatori delle variazioni dei valori per anni
In media:
14.325 Trln
Minima:
8.066 Trln
1 gen 1991 anni
Massimo:
25.347 Trln
1 gen 2016 anni
Alla data di osservazione
Valore
Variazione assoluta
La variazione rispetto al valore precedente
1 gen 1991 anni
8.066 Trln
+8.066 Trln
0.0%
1 gen 1992 anni
8.203 Trln
+136.818 Mlrd
1.7%
1 gen 1993 anni
8.279 Trln
+75.595 Mlrd
0.92%
1 gen 1994 anni
8.561 Trln
+282.589 Mlrd
3.41%
1 gen 1995 anni
8.77 Trln
+208.698 Mlrd
2.44%
1 gen 1996 anni
9.069 Trln
+299.376 Mlrd
3.41%
1 gen 1997 anni
9.502 Trln
+432.327 Mlrd
4.77%
1 gen 1998 anni
9.96 Trln
+458.027 Mlrd
4.82%
1 gen 1999 anni
10.081 Trln
+121.322 Mlrd
1.22%
1 gen 2000 anni
10.378 Trln
+296.834 Mlrd
2.94%
1 gen 2001 anni
10.992 Trln
+613.862 Mlrd
5.92%
1 gen 2002 anni
11.394 Trln
+401.919 Mlrd
3.66%
1 gen 2003 anni
11.882 Trln
+488.065 Mlrd
4.28%
1 gen 2004 anni
12.612 Trln
+730.482 Mlrd
6.15%
1 gen 2005 anni
13.622 Trln
+1.01 Trln
8.01%
1 gen 2006 anni
14.579 Trln
+957.457 Mlrd
7.03%
1 gen 2007 anni
15.811 Trln
+1.232 Trln
8.45%
1 gen 2008 anni
17.257 Trln
+1.445 Trln
9.14%
1 gen 2009 anni
18.23 Trln
+972.997 Mlrd
5.64%
1 gen 2010 anni
18.631 Trln
+400.983 Mlrd
2.2%
1 gen 2011 anni
20.09 Trln
+1.459 Trln
7.83%
1 gen 2012 anni
21.224 Trln
+1.134 Trln
5.65%
1 gen 2013 anni
22.248 Trln
+1.024 Trln
4.83%
1 gen 2014 anni
23.234 Trln
+985.639 Mlrd
4.43%
1 gen 2015 anni
24.441 Trln
+1.207 Trln
5.2%
1 gen 2016 anni
25.347 Trln
+906.115 Mlrd
3.71%
Classificazione dei paesi secondo i statistiche attuali per anni

Commenti:

Inviare
PremiumAbout & FeedbackAccordoPrivatezza
logo
© 2022 Selected Technologies LLC – Morgan Hill, California