29
/it/
it
AIzaSyAYiBZKx7MnpbEhh9jyipgxe19OcubqV5w
April 1, 2024
37371
IDA & IBRD total
IBT
false
2
1
GNI (constant 2010 US$)
2016,2015,2014,2013,2012,2011,2010,2009,2008,2007,2006,2005,2004,2003,2002,2001,2000,1999,1998,1997,1996,1995,1994,1993,1992,1991
Download
Biblioteca di statistiche globali →IDA & IBRD total →

GNI (constant 2010 US$)

Queste statistiche in altri paesi:
AfghanistanAlbaniaAlgeriaAndorraAngolaAntigua and BarbudaArab WorldArgentinaArmeniaAustraliaAustriaAzerbaijanBahamas, TheBahrainBangladeshBarbadosBelarusBelgiumBelizeBeninBermudaBhutanBoliviaBosnia and HerzegovinaBotswanaBrazilBrunei DarussalamBulgariaBurkina FasoBurundiCabo VerdeCambodiaCameroonCanadaCaribbean small statesCentral African RepublicCentral Europe and the BalticsChadChileChinaColombiaComorosCongo, Dem. Rep.Congo, Rep.Costa RicaCote d'IvoireCroatiaCubaCyprusCzech RepublicDenmarkDominicaDominican RepublicEarly-demographic dividendEast Asia & PacificEast Asia & Pacific (excluding high income)East Asia & Pacific (IDA & IBRD countries)EcuadorEgypt, Arab Rep.El SalvadorEquatorial GuineaEritreaEstoniaEthiopiaEuro areaEurope & Central AsiaEurope & Central Asia (excluding high income)Europe & Central Asia (IDA & IBRD countries)European UnionFaroe IslandsFijiFinlandFragile and conflict affected situationsFranceGabonGambia, TheGeorgiaGermanyGhanaGreeceGrenadaGuatemalaGuineaGuinea-BissauGuyanaHaitiHeavily indebted poor countries (HIPC)High incomeHondurasHong Kong SAR, ChinaHungaryIBRD onlyIcelandIDA & IBRD totalIDA blendIDA onlyIDA totalIndiaIndonesiaIran, Islamic Rep.IraqIrelandIsle of ManIsraelItalyJamaicaJapanJordanKazakhstanKenyaKiribatiKorea, Rep.KosovoKuwaitKyrgyz RepublicLao PDRLate-demographic dividendLatin America & Caribbean Latin America & Caribbean (excluding high income)Latin America & the Caribbean (IDA & IBRD countries)LatviaLeast developed countries: UN classificationLebanonLesothoLiberiaLibyaLiechtensteinLithuaniaLow & middle incomeLow incomeLower middle incomeLuxembourgMacao SAR, ChinaMacedonia, FYRMadagascarMalawiMalaysiaMaldivesMaliMaltaMarshall IslandsMauritaniaMauritiusMexicoMicronesia, Fed. Sts.Middle East & North AfricaMiddle East & North Africa (excluding high income)Middle East & North Africa (IDA & IBRD countries)Middle incomeMoldovaMongoliaMontenegroMoroccoMozambiqueMyanmarNamibiaNauruNepalNetherlandsNew ZealandNicaraguaNigerNigeriaNorth AmericaNorwayOECD membersOmanOther small statesPacific island small statesPakistanPalauPanamaPapua New GuineaParaguayPeruPhilippinesPolandPortugalPost-demographic dividendPre-demographic dividendPuerto RicoQatarRomaniaRussian FederationRwandaSamoaSao Tome and PrincipeSaudi ArabiaSenegalSerbiaSeychellesSierra LeoneSingaporeSlovak RepublicSloveniaSmall statesSolomon IslandsSouth AfricaSouth AsiaSouth Asia (IDA & IBRD)South SudanSpainSri LankaSt. Kitts and NevisSt. LuciaSt. Vincent and the GrenadinesSub-Saharan Africa Sub-Saharan Africa (excluding high income)Sub-Saharan Africa (IDA & IBRD countries)SudanSurinameSwazilandSwedenSwitzerlandTajikistanTanzaniaThailandTimor-LesteTogoTongaTrinidad and TobagoTunisiaTurkeyTurkmenistanTuvaluUgandaUkraineUnited Arab EmiratesUnited KingdomUnited StatesUpper middle incomeUruguayUzbekistanVanuatuVenezuela, RBVietnamWest Bank and GazaWorldYemen, Rep.ZambiaZimbabwe
Linea del tempo:
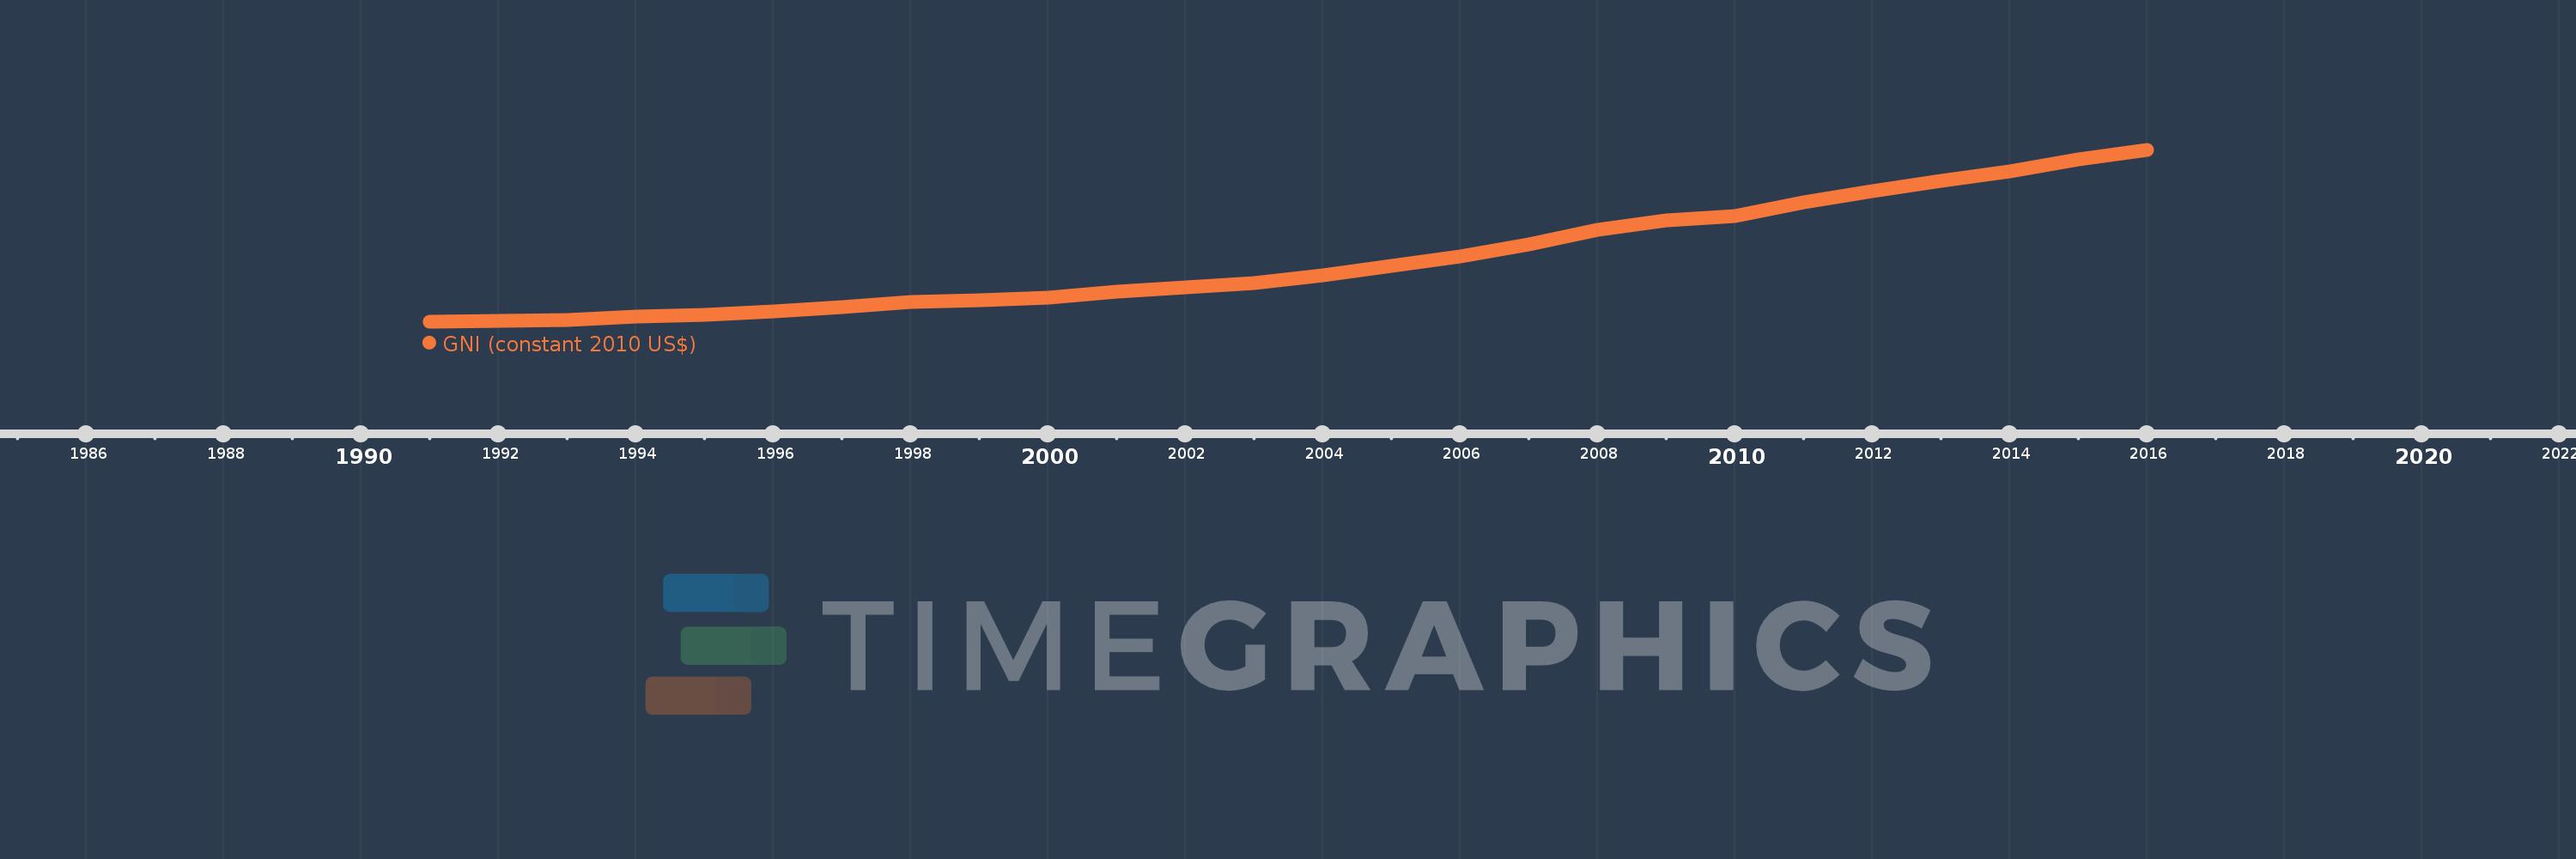
Questa scala temporale mostra un grafico dal 1991 anno al 2016 anno. IDA & IBRD total. I dati fino ad 1990 anno non disponibili. Il numero di osservazioni attuali secondo i date: 26.
La fonte (nome):
Indicatori dello sviluppo mondiale
La fonte (organizzazione):
World Bank national accounts data, and OECD National Accounts data files.
Categorie:
Economy & Growth
sono stati aggiornati
23 apr 2017 anni
Indicatori delle variazioni dei valori per anni
In media:
15.087 Trln
Minima:
8.49 Trln
1 gen 1991 anni
Massimo:
26.514 Trln
1 gen 2016 anni
Alla data di osservazione
Valore
Variazione assoluta
La variazione rispetto al valore precedente
1 gen 1991 anni
8.49 Trln
+8.49 Trln
0.0%
1 gen 1992 anni
8.645 Trln
+154.84 Mlrd
1.82%
1 gen 1993 anni
8.74 Trln
+94.368 Mlrd
1.09%
1 gen 1994 anni
9.048 Trln
+308.061 Mlrd
3.52%
1 gen 1995 anni
9.283 Trln
+235.617 Mlrd
2.6%
1 gen 1996 anni
9.616 Trln
+332.431 Mlrd
3.58%
1 gen 1997 anni
10.086 Trln
+470.503 Mlrd
4.89%
1 gen 1998 anni
10.58 Trln
+493.65 Mlrd
4.89%
1 gen 1999 anni
10.726 Trln
+145.998 Mlrd
1.38%
1 gen 2000 anni
11.035 Trln
+309.237 Mlrd
2.88%
1 gen 2001 anni
11.675 Trln
+639.892 Mlrd
5.8%
1 gen 2002 anni
12.092 Trln
+417.512 Mlrd
3.58%
1 gen 2003 anni
12.595 Trln
+502.559 Mlrd
4.16%
1 gen 2004 anni
13.346 Trln
+751.024 Mlrd
5.96%
1 gen 2005 anni
14.383 Trln
+1.037 Trln
7.77%
1 gen 2006 anni
15.375 Trln
+991.6 Mlrd
6.89%
1 gen 2007 anni
16.64 Trln
+1.265 Trln
8.23%
1 gen 2008 anni
18.135 Trln
+1.495 Trln
8.98%
1 gen 2009 anni
19.159 Trln
+1.025 Trln
5.65%
1 gen 2010 anni
19.572 Trln
+413.139 Mlrd
2.16%
1 gen 2011 anni
21.068 Trln
+1.496 Trln
7.64%
1 gen 2012 anni
22.249 Trln
+1.181 Trln
5.61%
1 gen 2013 anni
23.305 Trln
+1.056 Trln
4.75%
1 gen 2014 anni
24.325 Trln
+1.02 Trln
4.37%
1 gen 2015 anni
25.568 Trln
+1.243 Trln
5.11%
1 gen 2016 anni
26.514 Trln
+946.511 Mlrd
3.7%
Classificazione dei paesi secondo i statistiche attuali per anni

Commenti:

Inviare
PremiumAbout & FeedbackAccordoPrivatezza
logo
© 2022 Selected Technologies LLC – Morgan Hill, California