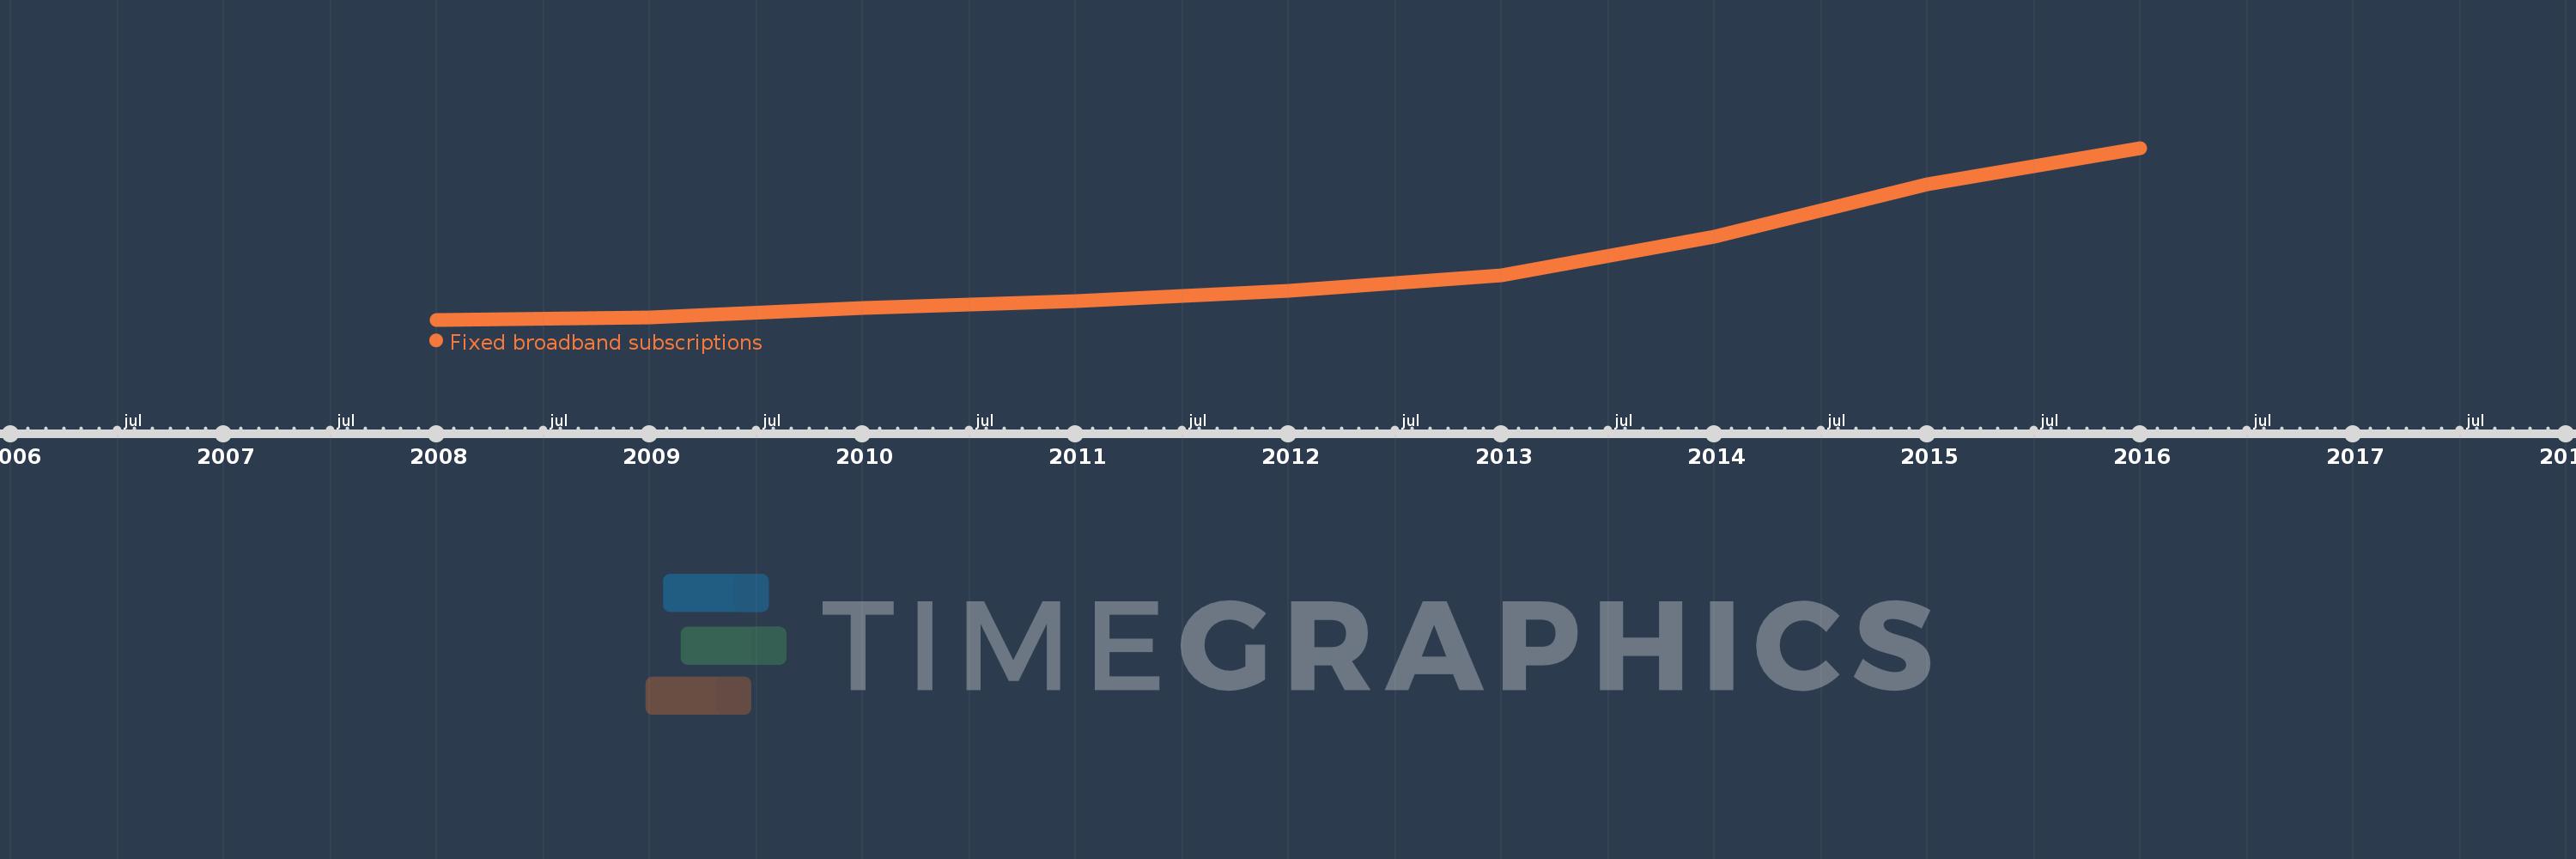
Questa scala temporale mostra un grafico dal 2008 anno al 2016 anno. IDA only. I dati fino ad 2007 anno non disponibili. Il numero di osservazioni attuali secondo i date: 9.
La fonte (nome):
Indicatori dello sviluppo mondiale
La fonte (organizzazione):
International Telecommunication Union, World Telecommunication/ICT Development Report and database.
Categorie:
Infrastructure
sono stati aggiornati
23 apr 2017 anni
Indicatori delle variazioni dei valori per anni
In media:
2.76 Mln
Minima:
303.798 Mille.
1 gen 2008 anni
Massimo:
7.946 Mln
1 gen 2016 anni
Alla data di osservazione
Valore
Variazione assoluta
La variazione rispetto al valore precedente
1 gen 2008 anni
303.798 Mille.
+303.798 Mille.
0.0%
1 gen 2009 anni
419.475 Mille.
+115.677 Mille.
38.08%
1 gen 2010 anni
832.728 Mille.
+413.253 Mille.
98.52%
1 gen 2011 anni
1.146 Mln
+313.075 Mille.
37.6%
1 gen 2012 anni
1.577 Mln
+431.216 Mille.
37.63%
1 gen 2013 anni
2.282 Mln
+705.235 Mille.
44.72%
1 gen 2014 anni
4.003 Mln
+1.721 Mln
75.4%
1 gen 2015 anni
6.331 Mln
+2.327 Mln
58.14%
1 gen 2016 anni
7.946 Mln
+1.615 Mln
25.51%
Classificazione dei paesi secondo i statistiche attuali per anni