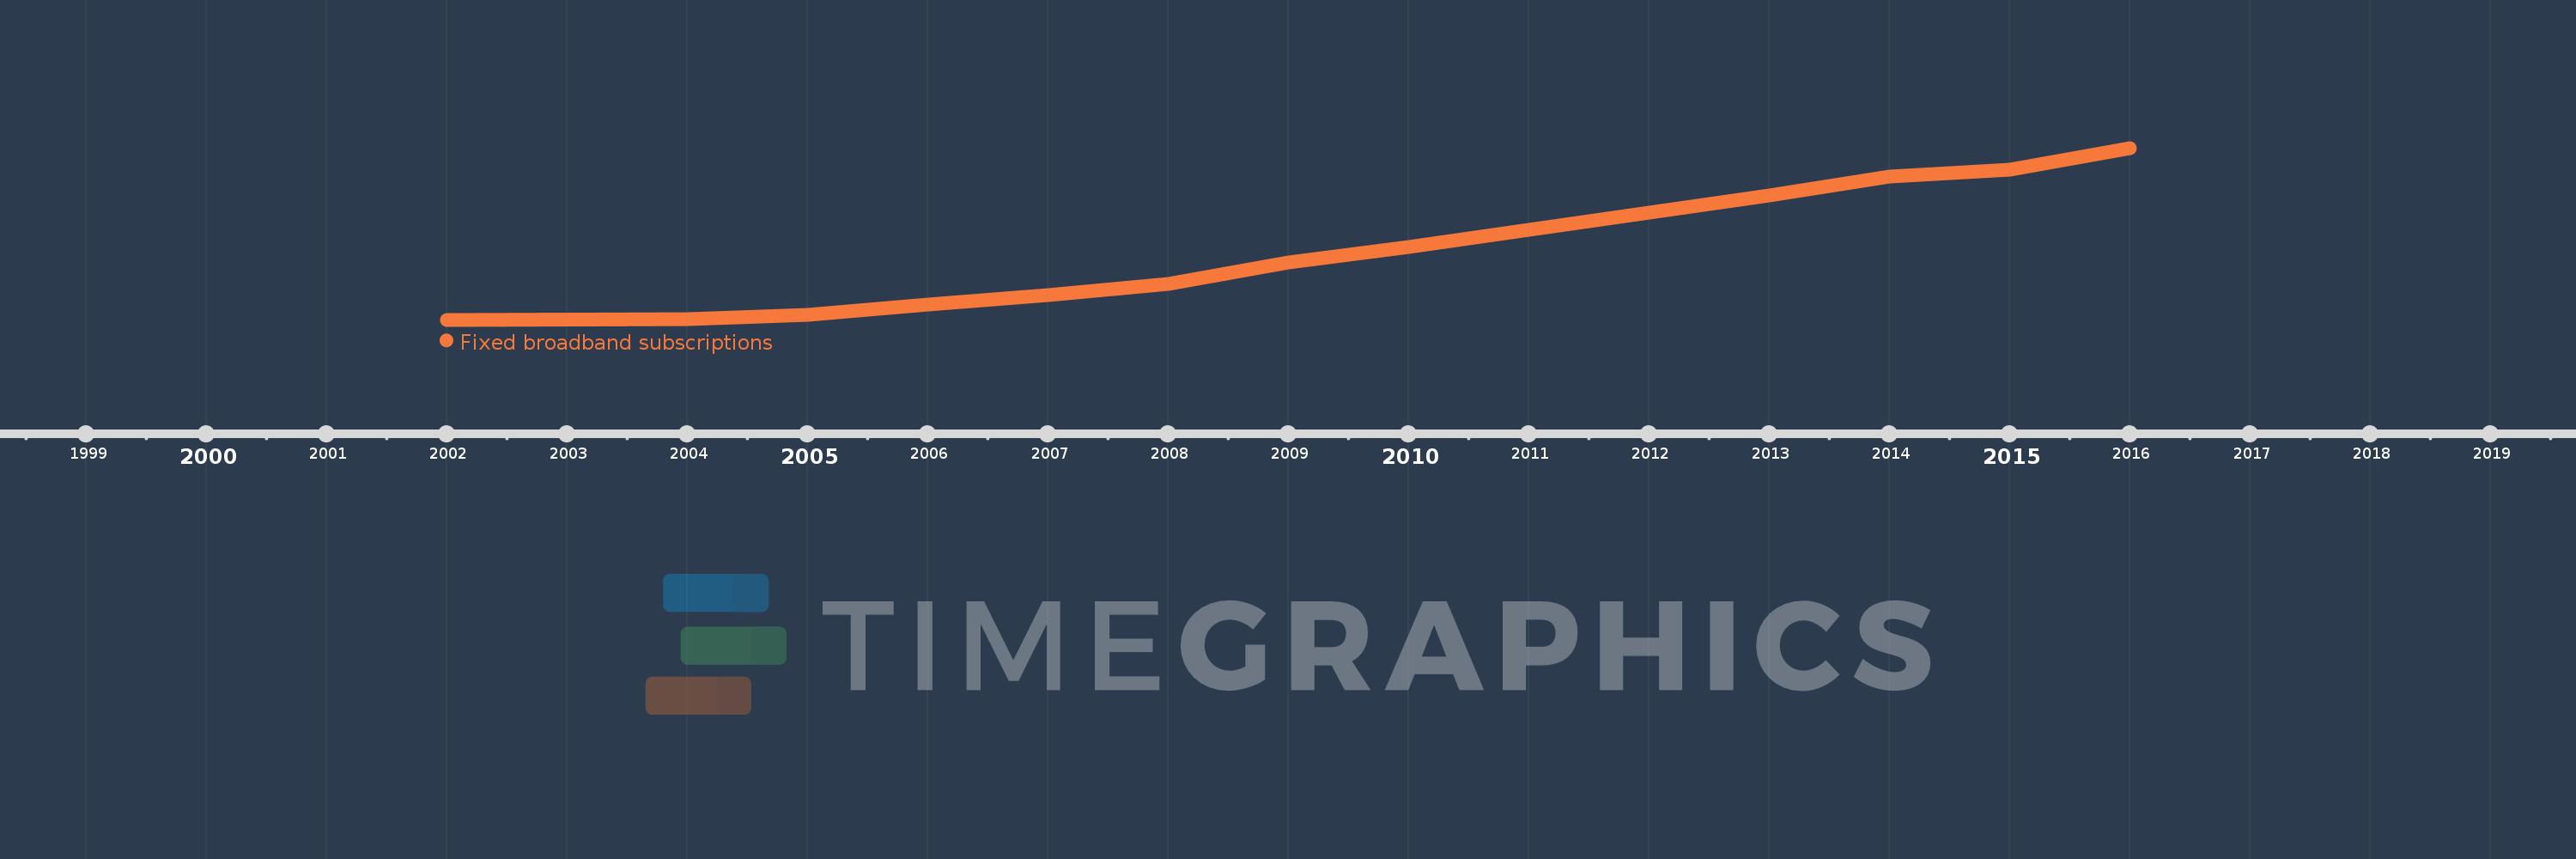
Questa scala temporale mostra un grafico dal 2002 anno al 2016 anno. Thailand. I dati fino ad 2001 anno non disponibili. Il numero di osservazioni attuali secondo i date: 14.
La fonte (nome):
Indicatori dello sviluppo mondiale
La fonte (organizzazione):
International Telecommunication Union, World Telecommunication/ICT Development Report and database.
Categorie:
Infrastructure
sono stati aggiornati
23 apr 2017 anni
Indicatori delle variazioni dei valori per anni
In media:
2.582 Mln
Minima:
1.613 Mille.
1 gen 2002 anni
Massimo:
6.229 Mln
1 gen 2016 anni
Alla data di osservazione
Valore
Variazione assoluta
La variazione rispetto al valore precedente
1 gen 2002 anni
1.613 Mille.
+1.613 Mille.
0.0%
1 gen 2004 anni
11.611 Mille.
+9.998 Mille.
619.84%
1 gen 2005 anni
164.775 Mille.
+153.164 Mille.
1.32 Mille.%
1 gen 2006 anni
555.495 Mille.
+390.72 Mille.
237.12%
1 gen 2007 anni
893.548 Mille.
+338.053 Mille.
60.86%
1 gen 2008 anni
1.293 Mln
+399.793 Mille.
44.74%
1 gen 2009 anni
2.073 Mln
+779.458 Mille.
60.27%
1 gen 2010 anni
2.624 Mln
+551.479 Mille.
26.61%
1 gen 2011 anni
3.252 Mln
+627.573 Mille.
23.91%
1 gen 2012 anni
3.895 Mln
+643.149 Mille.
19.78%
1 gen 2013 anni
4.519 Mln
+624.0 Mille.
16.02%
1 gen 2014 anni
5.192 Mln
+673.0 Mille.
14.89%
1 gen 2015 anni
5.44 Mln
+248.0 Mille.
4.78%
1 gen 2016 anni
6.229 Mln
+789.0 Mille.
14.5%
Classificazione dei paesi secondo i statistiche attuali per anni