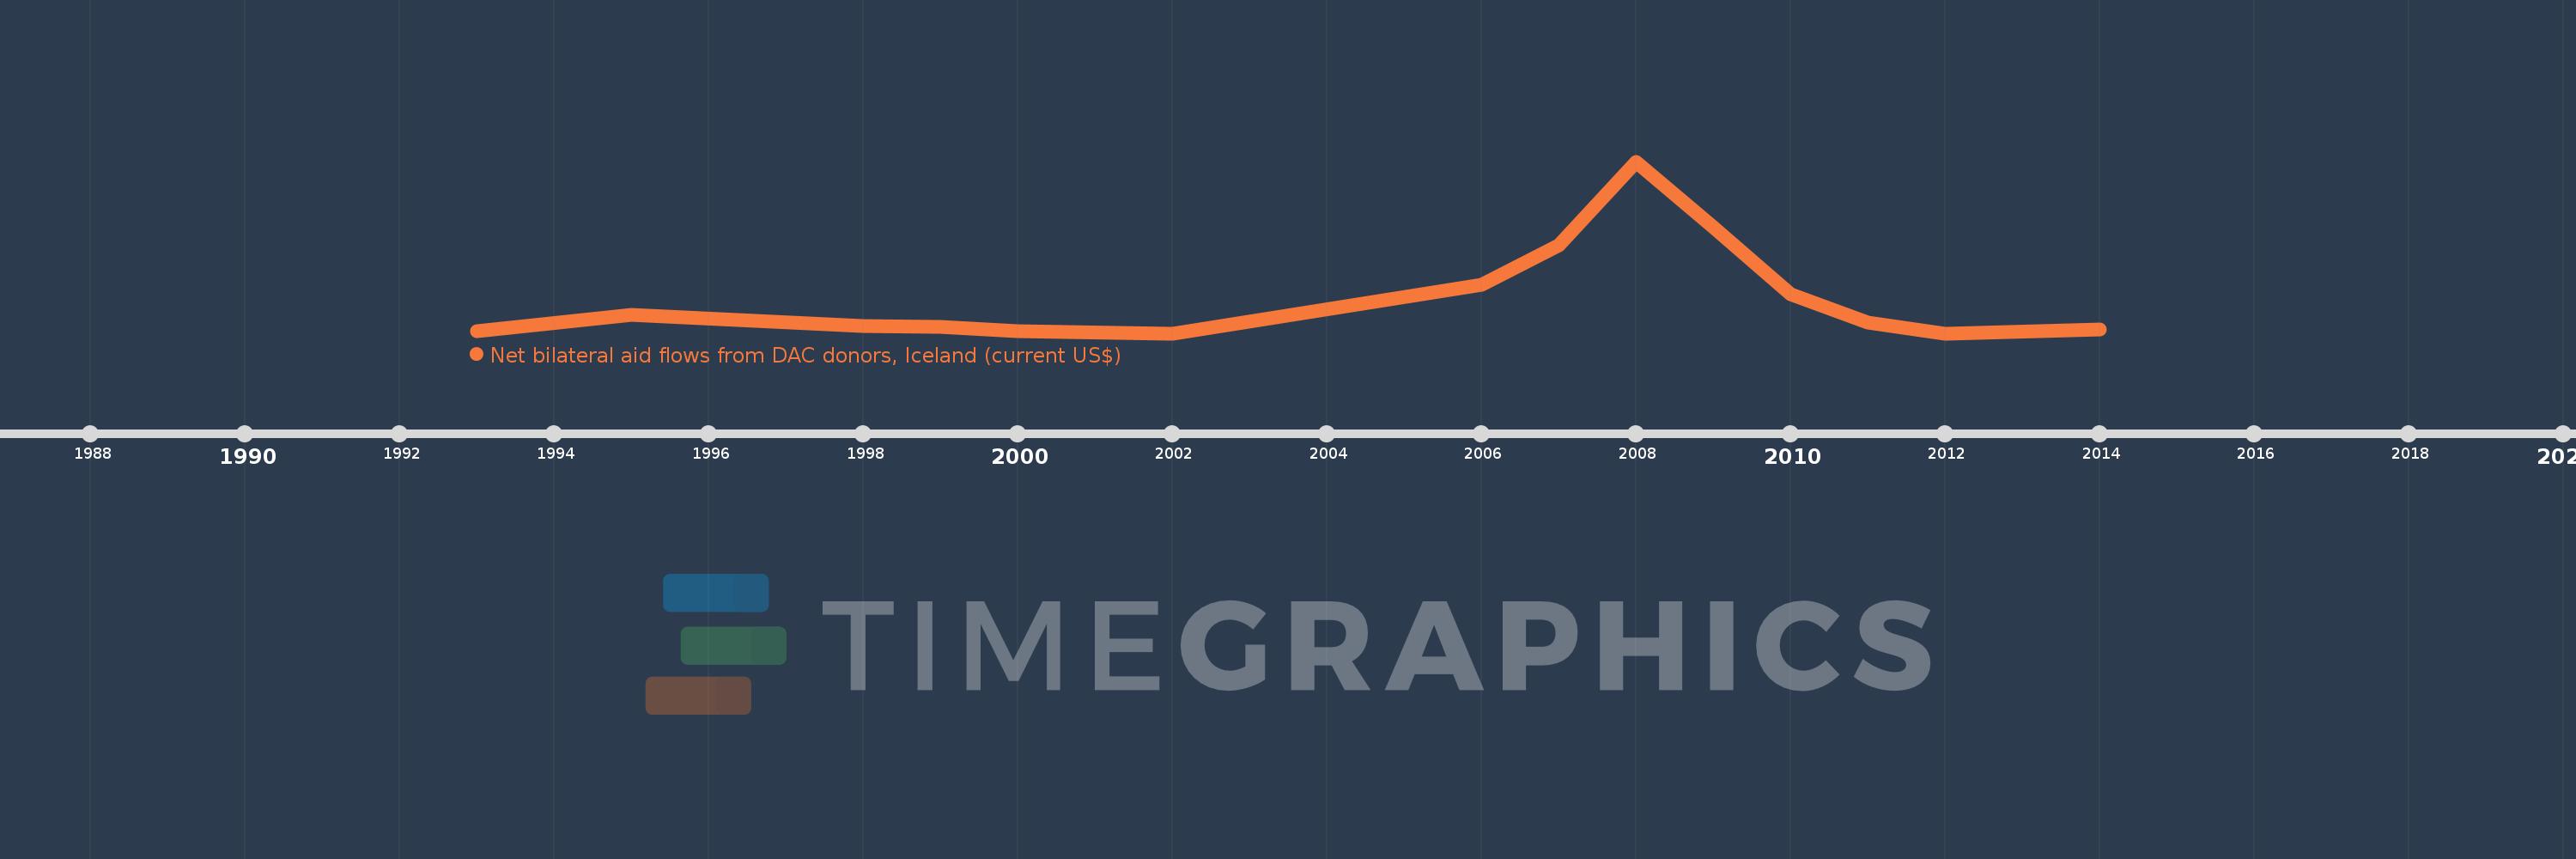
Questa scala temporale mostra un grafico dal 1993 anno al 2014 anno. IDA blend. I dati fino ad 1992 anno non disponibili. Il numero di osservazioni attuali secondo i date: 14.
La fonte (nome):
Indicatori dello sviluppo mondiale
La fonte (organizzazione):
Development Assistance Committee of the Organisation for Economic Co-operation and Development, Geographical Distribution of Financial Flows to Developing Countries, Development Co-operation Report, and International Development Statistics database. Data are available online at: www.oecd.org/dac/stats/idsonline.
Categorie:
Aid Effectiveness
sono stati aggiornati
23 apr 2017 anni
Indicatori delle variazioni dei valori per anni
In media:
850.714 Mille.
Minima:
60.0 Mille.
1 gen 2002 anni
Massimo:
3.82 Mln
1 gen 2008 anni
Alla data di osservazione
Valore
Variazione assoluta
La variazione rispetto al valore precedente
1 gen 1993 anni
100.0 Mille.
+100.0 Mille.
0.0%
1 gen 1995 anni
470.0 Mille.
+370.0 Mille.
370.0%
1 gen 1998 anni
220.0 Mille.
-250.0 Mille.
-53.19%
1 gen 1999 anni
210.0 Mille.
-10.0 Mille.
-4.55%
1 gen 2000 anni
110.0 Mille.
-100.0 Mille.
-47.62%
1 gen 2002 anni
60.0 Mille.
-50.0 Mille.
-45.45%
1 gen 2006 anni
1.13 Mln
+1.07 Mln
1.78 Mille.%
1 gen 2007 anni
1.98 Mln
+850.0 Mille.
75.22%
1 gen 2008 anni
3.82 Mln
+1.84 Mln
92.93%
1 gen 2009 anni
2.39 Mln
-1.43 Mln
-37.43%
1 gen 2010 anni
920.0 Mille.
-1.47 Mln
-61.51%
1 gen 2011 anni
300.0 Mille.
-620.0 Mille.
-67.39%
1 gen 2012 anni
60.0 Mille.
-240.0 Mille.
-80.0%
1 gen 2014 anni
140.0 Mille.
+80.0 Mille.
133.33%
Classificazione dei paesi secondo i statistiche attuali per anni