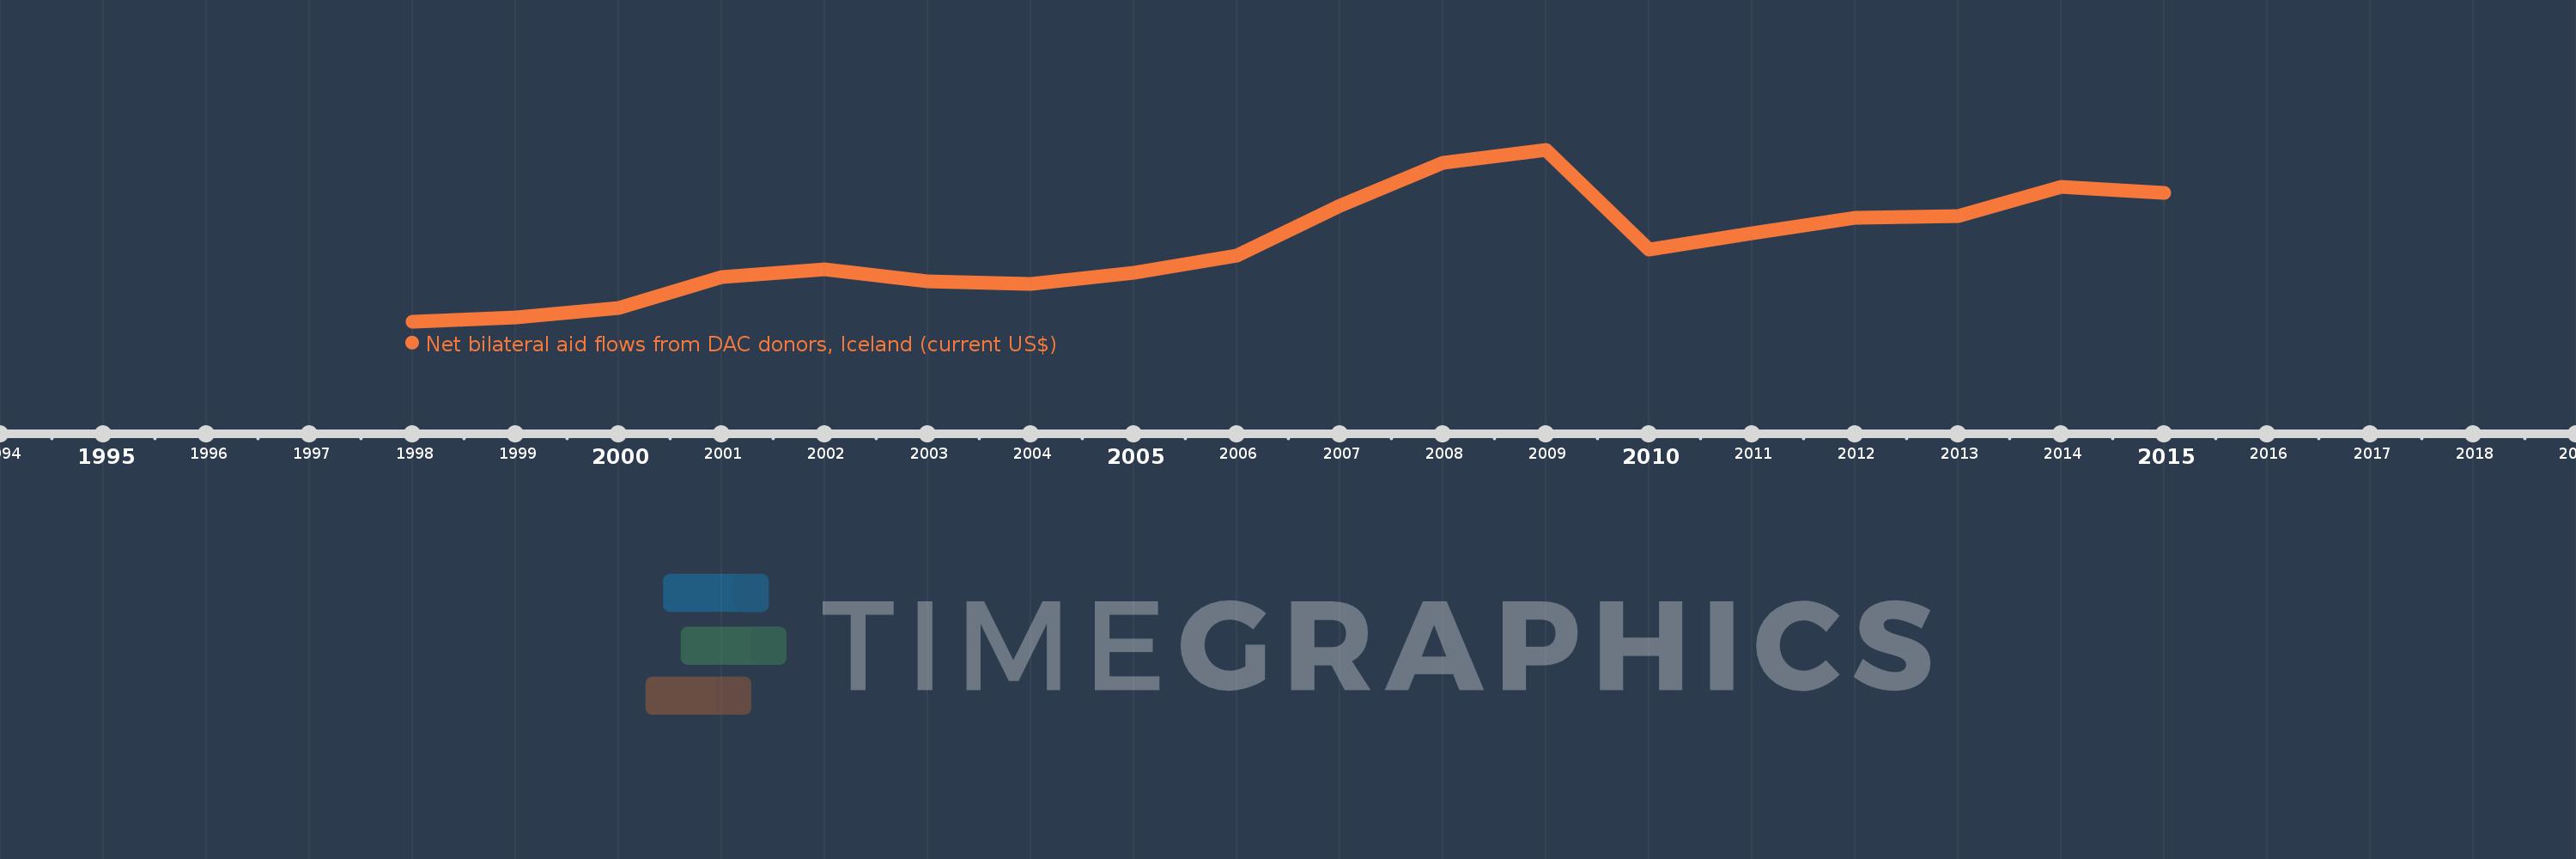
Questa scala temporale mostra un grafico dal 1998 anno al 2015 anno. Mozambique. I dati fino ad 1997 anno non disponibili. Il numero di osservazioni attuali secondo i date: 18.
La fonte (nome):
Indicatori dello sviluppo mondiale
La fonte (organizzazione):
Development Assistance Committee of the Organisation for Economic Co-operation and Development, Geographical Distribution of Financial Flows to Developing Countries, Development Co-operation Report, and International Development Statistics database. Data are available online at: www.oecd.org/dac/stats/idsonline.
Categorie:
Aid Effectiveness
sono stati aggiornati
23 apr 2017 anni
Indicatori delle variazioni dei valori per anni
In media:
1.773 Mln
Minima:
300.0 Mille.
1 gen 1998 anni
Massimo:
3.57 Mln
1 gen 2009 anni
Alla data di osservazione
Valore
Variazione assoluta
La variazione rispetto al valore precedente
1 gen 1998 anni
300.0 Mille.
+300.0 Mille.
0.0%
1 gen 1999 anni
390.0 Mille.
+90.0 Mille.
30.0%
1 gen 2000 anni
560.0 Mille.
+170.0 Mille.
43.59%
1 gen 2001 anni
1.16 Mln
+600.0 Mille.
107.14%
1 gen 2002 anni
1.3 Mln
+140.0 Mille.
12.07%
1 gen 2003 anni
1.07 Mln
-230.0 Mille.
-17.69%
1 gen 2004 anni
1.02 Mln
-50.0 Mille.
-4.67%
1 gen 2005 anni
1.24 Mln
+220.0 Mille.
21.57%
1 gen 2006 anni
1.56 Mln
+320.0 Mille.
25.81%
1 gen 2007 anni
2.52 Mln
+960.0 Mille.
61.54%
1 gen 2008 anni
3.33 Mln
+810.0 Mille.
32.14%
1 gen 2009 anni
3.57 Mln
+240.0 Mille.
7.21%
1 gen 2010 anni
1.68 Mln
-1.89 Mln
-52.94%
1 gen 2011 anni
1.99 Mln
+310.0 Mille.
18.45%
1 gen 2012 anni
2.29 Mln
+300.0 Mille.
15.08%
1 gen 2013 anni
2.31 Mln
+20.0 Mille.
0.87%
1 gen 2014 anni
2.88 Mln
+570.0 Mille.
24.68%
1 gen 2015 anni
2.75 Mln
-130.0 Mille.
-4.51%
Classificazione dei paesi secondo i statistiche attuali per anni