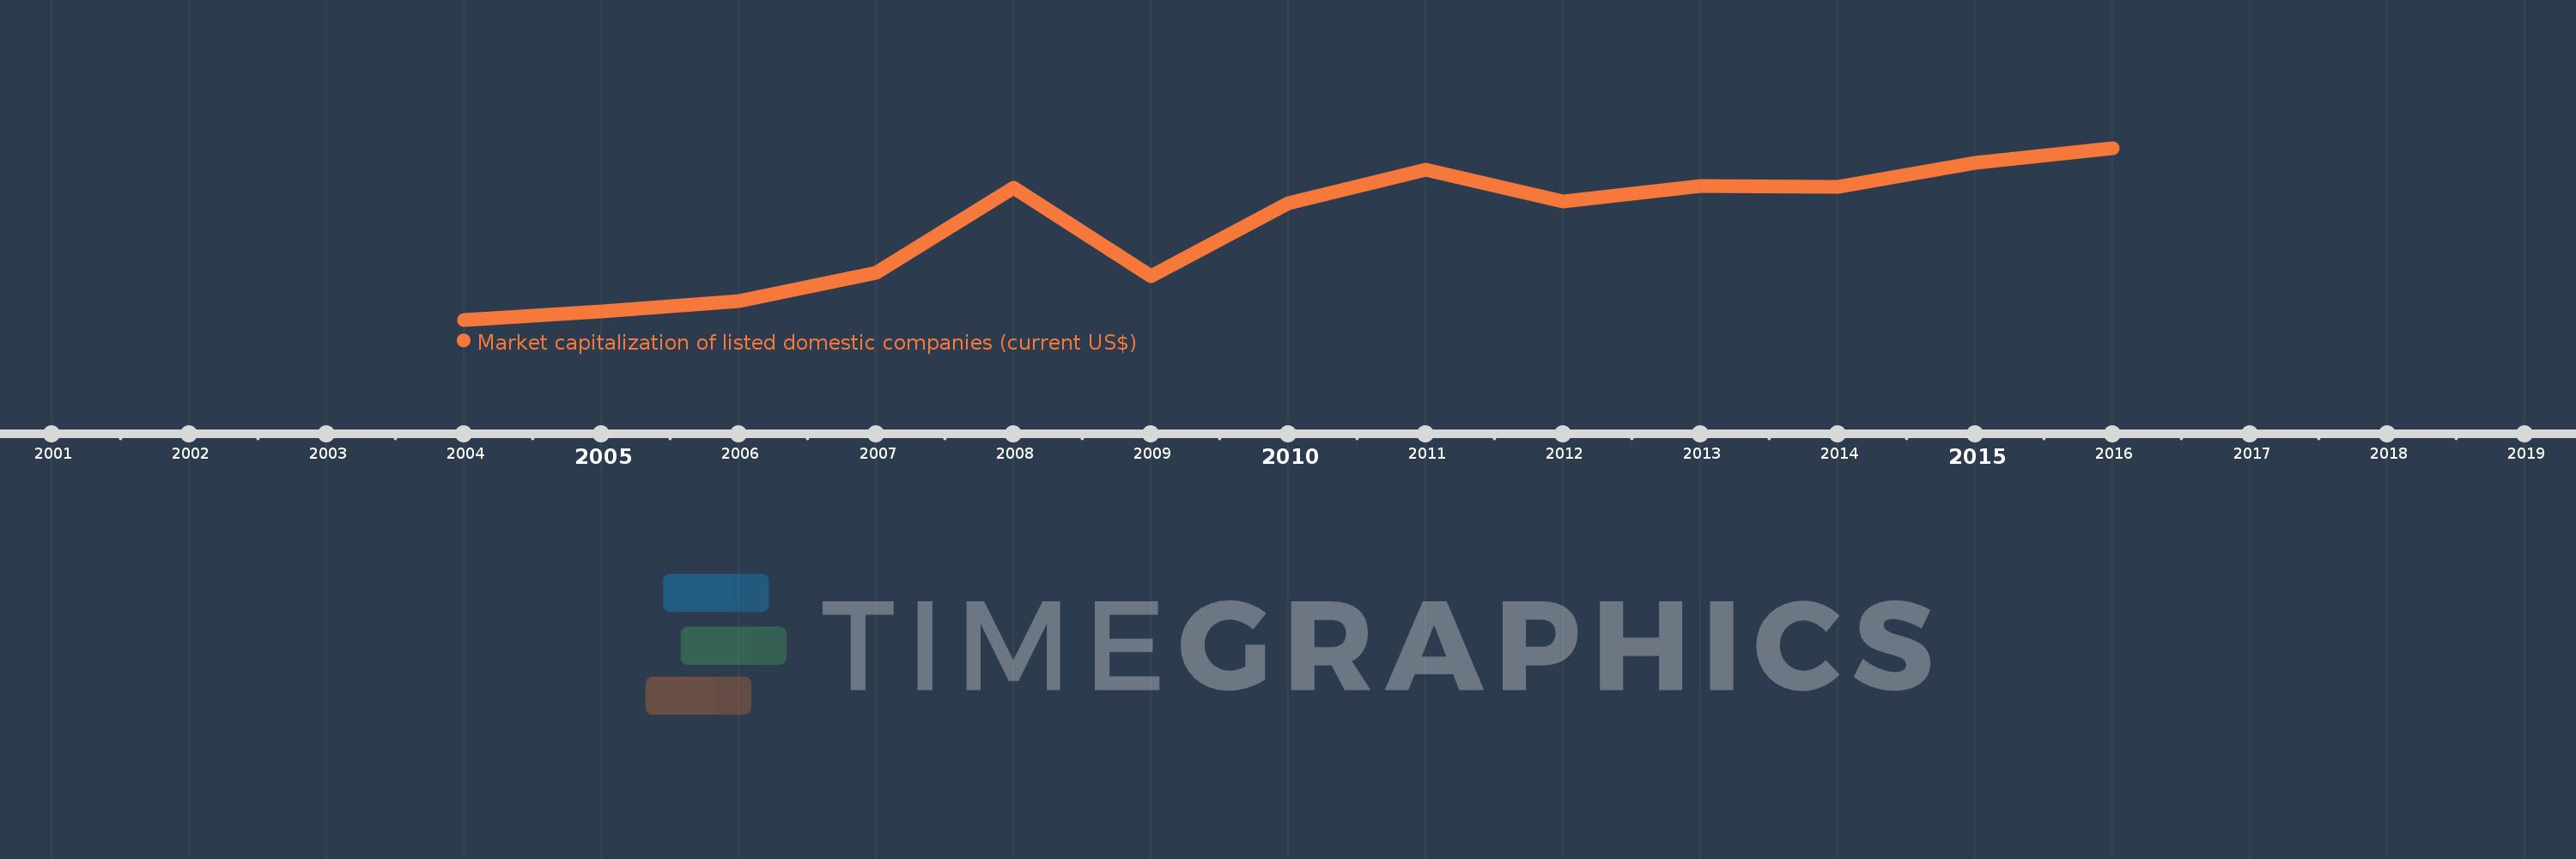
Questa scala temporale mostra un grafico dal 2004 anno al 2016 anno. IDA & IBRD total. I dati fino ad 2003 anno non disponibili. Il numero di osservazioni attuali secondo i date: 13.
La fonte (nome):
Indicatori dello sviluppo mondiale
La fonte (organizzazione):
World Federation of Exchanges database.
Categorie:
Financial Sector
sono stati aggiornati
23 apr 2017 anni
Indicatori delle variazioni dei valori per anni
In media:
8.727 Trln
Minima:
2.076 Trln
1 gen 2004 anni
Massimo:
14.159 Trln
1 gen 2016 anni
Alla data di osservazione
Valore
Variazione assoluta
La variazione rispetto al valore precedente
1 gen 2004 anni
2.076 Trln
+2.076 Trln
0.0%
1 gen 2005 anni
2.692 Trln
+615.129 Mlrd
29.62%
1 gen 2006 anni
3.364 Trln
+672.104 Mlrd
24.97%
1 gen 2007 anni
5.358 Trln
+1.995 Trln
59.3%
1 gen 2008 anni
11.343 Trln
+5.985 Trln
111.69%
1 gen 2009 anni
5.118 Trln
-6.225 Trln
-54.88%
1 gen 2010 anni
10.247 Trln
+5.129 Trln
100.23%
1 gen 2011 anni
12.62 Trln
+2.373 Trln
23.16%
1 gen 2012 anni
10.39 Trln
-2.23 Trln
-17.67%
1 gen 2013 anni
11.506 Trln
+1.116 Trln
10.74%
1 gen 2014 anni
11.442 Trln
-63.881 Mlrd
-0.56%
1 gen 2015 anni
13.13 Trln
+1.688 Trln
14.75%
1 gen 2016 anni
14.159 Trln
+1.029 Trln
7.84%
Classificazione dei paesi secondo i statistiche attuali per anni