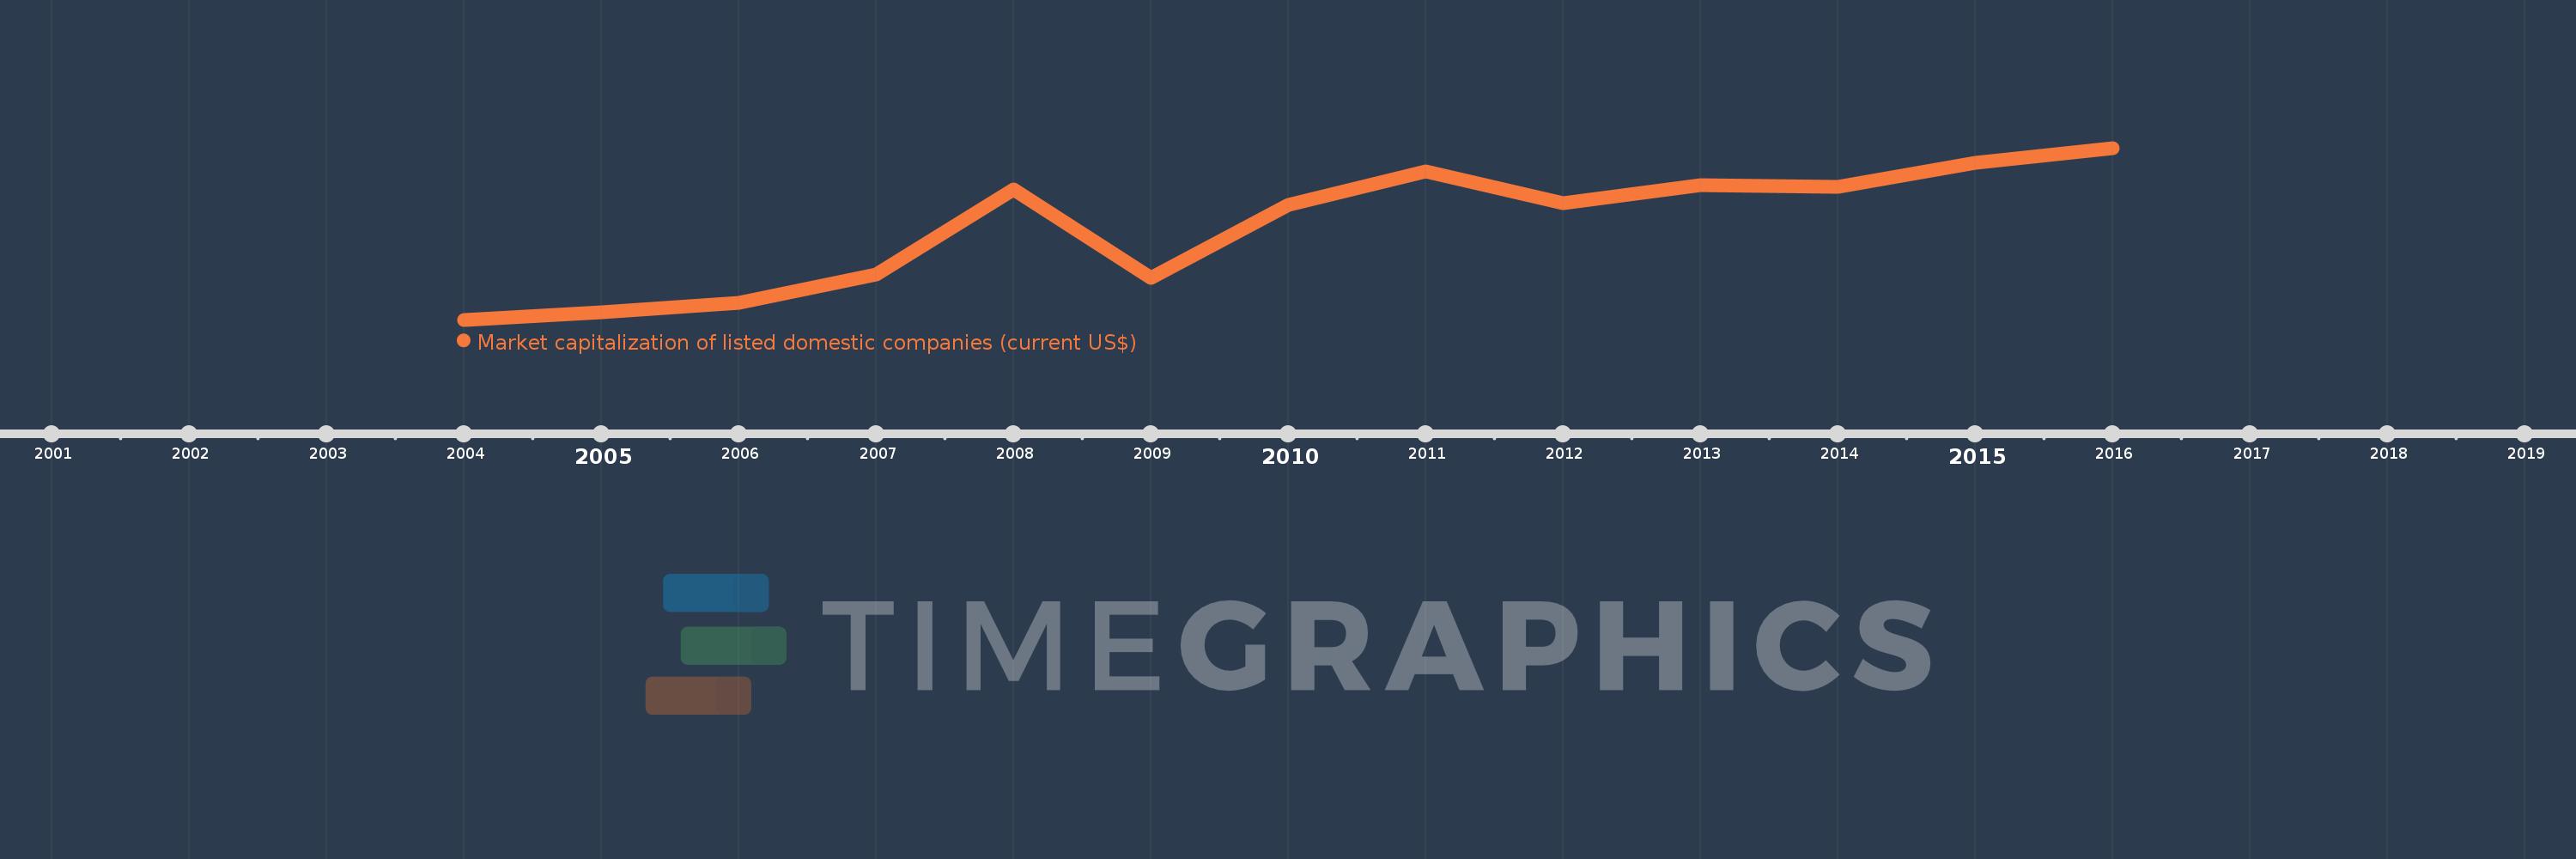
Questa scala temporale mostra un grafico dal 2004 anno al 2016 anno. IBRD only. I dati fino ad 2003 anno non disponibili. Il numero di osservazioni attuali secondo i date: 13.
La fonte (nome):
Indicatori dello sviluppo mondiale
La fonte (organizzazione):
World Federation of Exchanges database.
Categorie:
Financial Sector
sono stati aggiornati
23 apr 2017 anni
Indicatori delle variazioni dei valori per anni
In media:
8.59 Trln
Minima:
2.062 Trln
1 gen 2004 anni
Massimo:
14.024 Trln
1 gen 2016 anni
Alla data di osservazione
Valore
Variazione assoluta
La variazione rispetto al valore precedente
1 gen 2004 anni
2.062 Trln
+2.062 Trln
0.0%
1 gen 2005 anni
2.612 Trln
+550.147 Mlrd
26.68%
1 gen 2006 anni
3.266 Trln
+654.177 Mlrd
25.04%
1 gen 2007 anni
5.238 Trln
+1.972 Trln
60.36%
1 gen 2008 anni
11.132 Trln
+5.894 Trln
112.52%
1 gen 2009 anni
4.981 Trln
-6.151 Trln
-55.26%
1 gen 2010 anni
10.08 Trln
+5.1 Trln
102.39%
1 gen 2011 anni
12.396 Trln
+2.316 Trln
22.98%
1 gen 2012 anni
10.179 Trln
-2.217 Trln
-17.89%
1 gen 2013 anni
11.418 Trln
+1.24 Trln
12.18%
1 gen 2014 anni
11.291 Trln
-127.436 Mlrd
-1.12%
1 gen 2015 anni
12.985 Trln
+1.694 Trln
15.0%
1 gen 2016 anni
14.024 Trln
+1.039 Trln
8.0%
Classificazione dei paesi secondo i statistiche attuali per anni