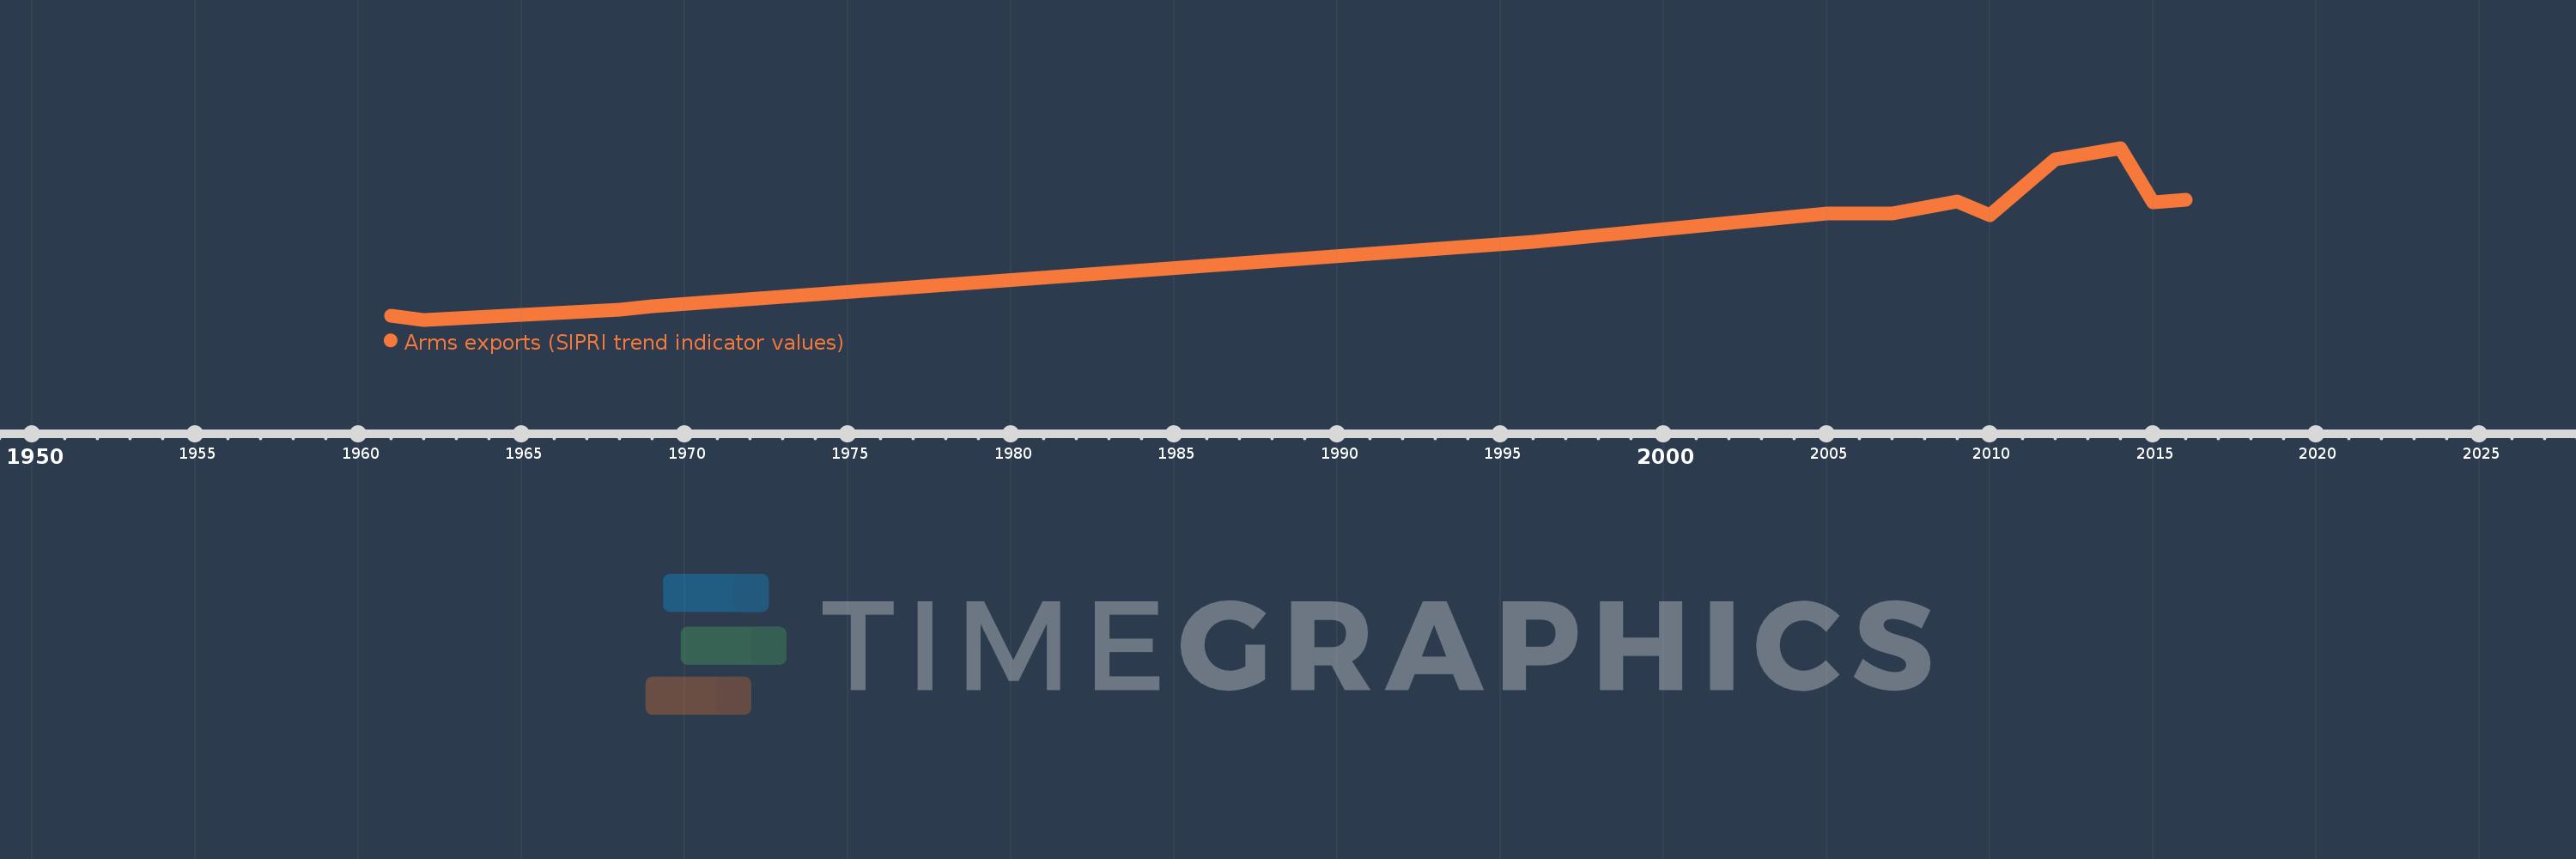
Questa scala temporale mostra un grafico dal 1961 anno al 2016 anno. IBRD only. I dati fino ad 1960 anno non disponibili. Il numero di osservazioni attuali secondo i date: 13.
La fonte (nome):
Indicatori dello sviluppo mondiale
La fonte (organizzazione):
Stockholm International Peace Research Institute (SIPRI), Arms Transfers Programme (http://portal.sipri.org/publications/pages/transfer/splash).
Categorie:
Public Sector, Trade
sono stati aggiornati
23 apr 2017 anni
Indicatori delle variazioni dei valori per anni
In media:
5.893 Mlrd
Minima:
85.0 Mln
1 gen 1962 anni
Massimo:
11.764 Mlrd
1 gen 2014 anni
Alla data di osservazione
Valore
Variazione assoluta
La variazione rispetto al valore precedente
1 gen 1961 anni
334.0 Mln
+334.0 Mln
0.0%
1 gen 1962 anni
85.0 Mln
-249.0 Mln
-74.55%
1 gen 1968 anni
752.0 Mln
+667.0 Mln
784.71%
1 gen 1969 anni
1.015 Mlrd
+263.0 Mln
34.97%
1 gen 1996 anni
5.371 Mlrd
+4.356 Mlrd
429.16%
1 gen 2005 anni
7.321 Mlrd
+1.95 Mlrd
36.31%
1 gen 2007 anni
7.333 Mlrd
+12.0 Mln
0.16%
1 gen 2009 anni
8.145 Mlrd
+812.0 Mln
11.07%
1 gen 2010 anni
7.173 Mlrd
-972.0 Mln
-11.93%
1 gen 2012 anni
10.997 Mlrd
+3.824 Mlrd
53.31%
1 gen 2014 anni
11.764 Mlrd
+767.0 Mln
6.97%
1 gen 2015 anni
8.055 Mlrd
-3.709 Mlrd
-31.53%
1 gen 2016 anni
8.267 Mlrd
+212.0 Mln
2.63%
Classificazione dei paesi secondo i statistiche attuali per anni