33
/it/
AIzaSyB4mHJ5NPEv-XzF7P6NDYXjlkCWaeKw5bc
November 30, 2025
31323
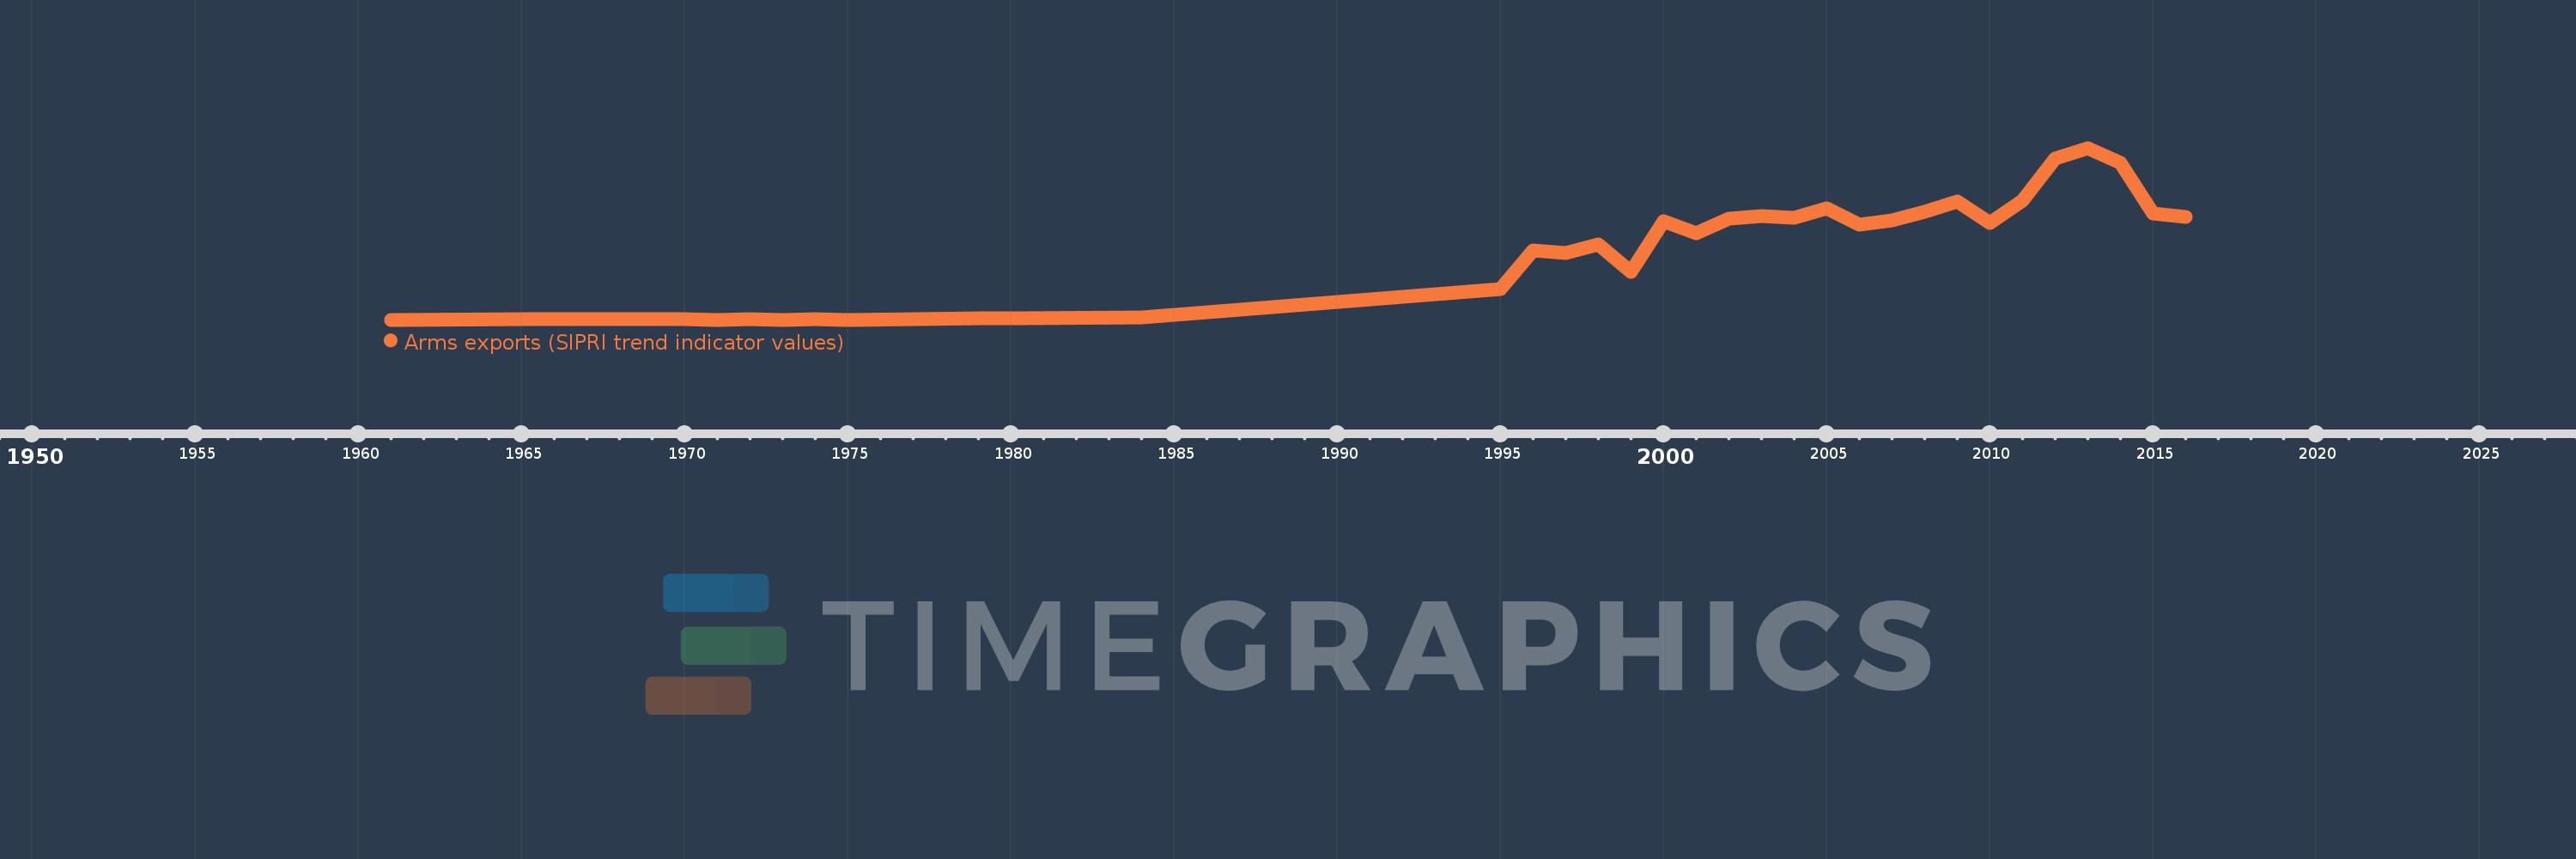
Europe & Central Asia (excluding high income)
ECA
false
2
1
Arms exports (SIPRI trend indicator values)
2016,2015,2014,2013,2012,2011,2010,2009,2008,2007,2006,2005,2004,2003,2002,2001,2000,1999,1998,1997,1996,1995,1984,1980,1979,1975,1974,1973,1972,1971,1970,1966,1965,1961