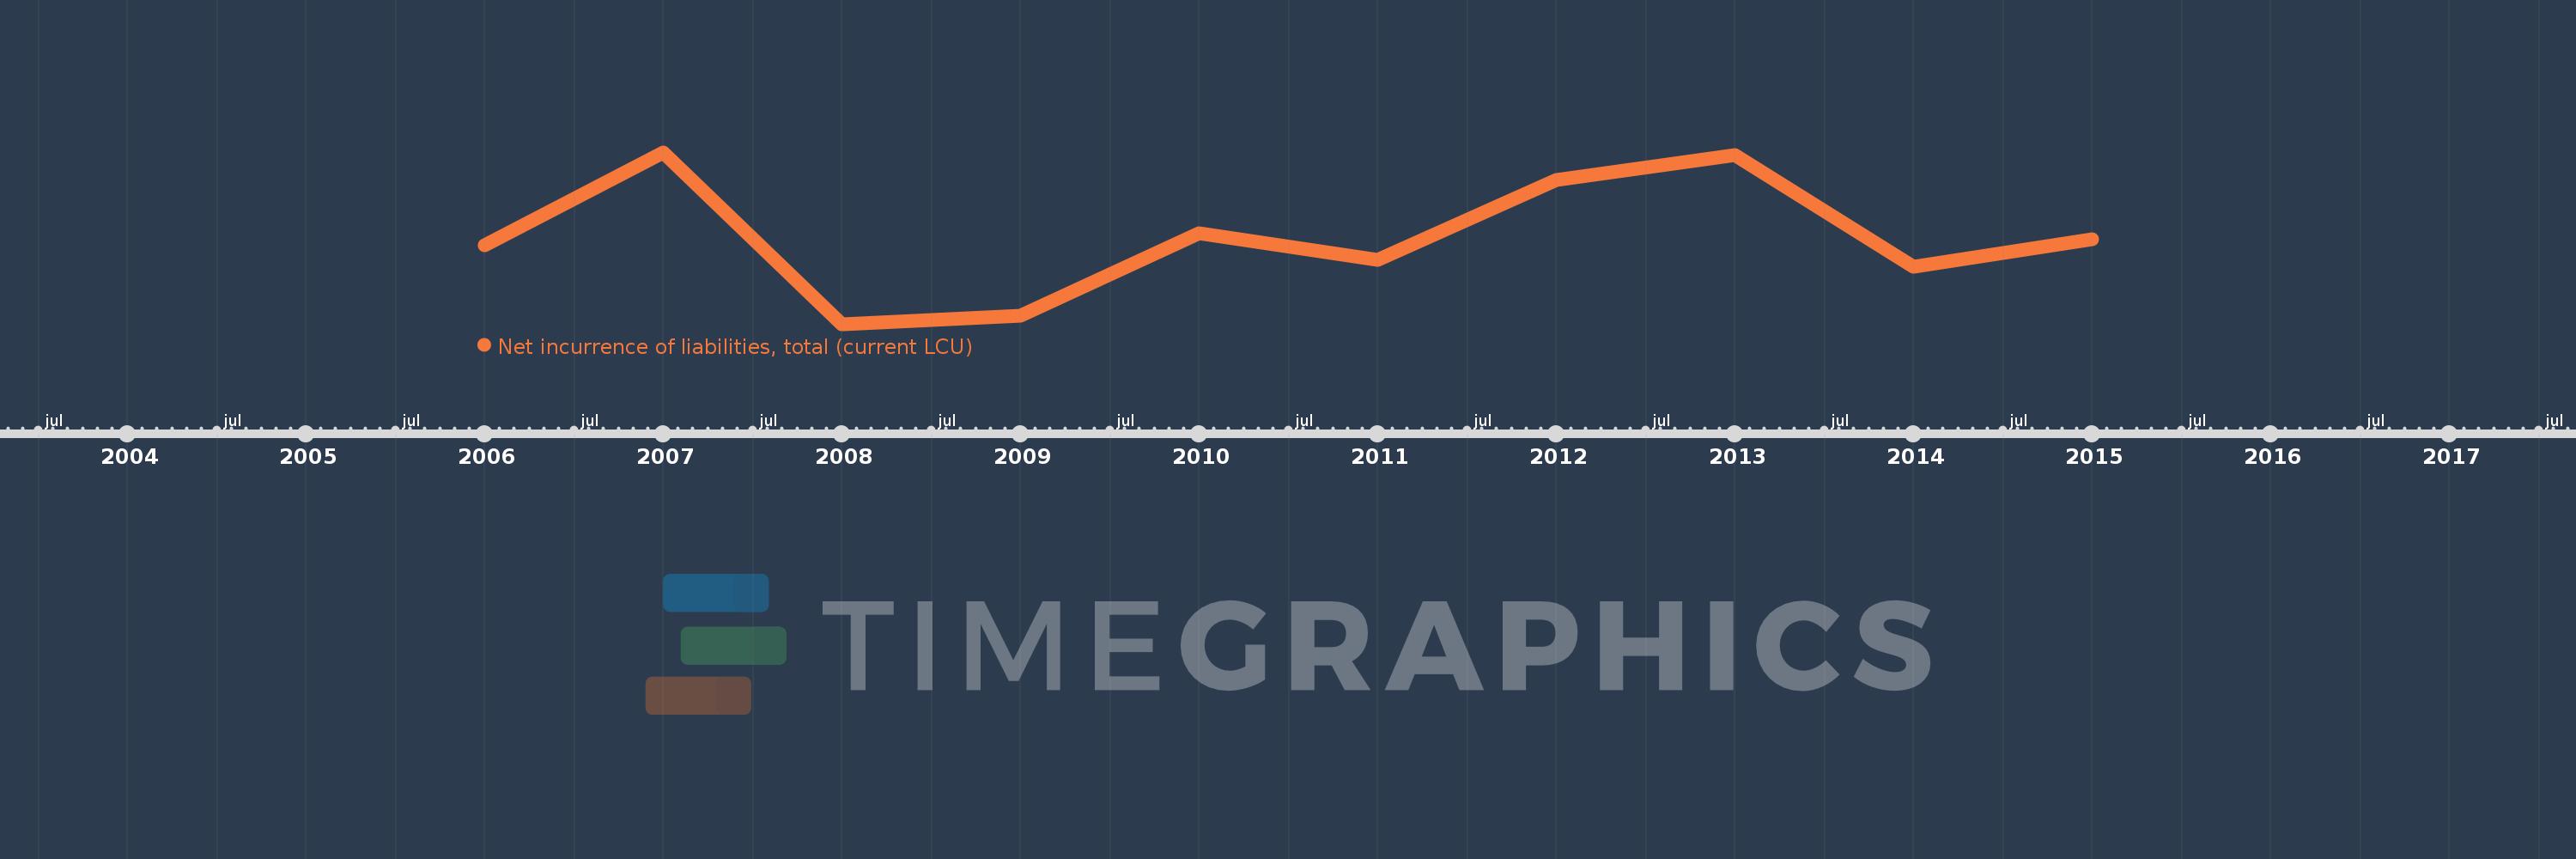
Questa scala temporale mostra un grafico dal 2006 anno al 2015 anno. West Bank and Gaza. I dati fino ad 2005 anno non disponibili. Il numero di osservazioni attuali secondo i date: 10.
La fonte (nome):
Indicatori dello sviluppo mondiale
La fonte (organizzazione):
International Monetary Fund, Government Finance Statistics Yearbook and data files.
Categorie:
Public Sector
sono stati aggiornati
23 apr 2017 anni
Indicatori delle variazioni dei valori per anni
In media:
423.016 Mln
Minima:
-78.0 Mln
1 gen 2008 anni
Massimo:
910.62 Mln
1 gen 2007 anni
Alla data di osservazione
Valore
Variazione assoluta
La variazione rispetto al valore precedente
1 gen 2006 anni
374.963 Mln
+374.963 Mln
0.0%
1 gen 2007 anni
910.62 Mln
+535.657 Mln
142.86%
1 gen 2008 anni
-78.0 Mln
-988.62 Mln
-108.57%
1 gen 2009 anni
-26.73 Mln
+51.27 Mln
-65.73%
1 gen 2010 anni
445.906 Mln
+472.636 Mln
-1.77 Mille.%
1 gen 2011 anni
294.3 Mln
-151.606 Mln
-34.0%
1 gen 2012 anni
752.242 Mln
+457.942 Mln
155.6%
1 gen 2013 anni
893.481 Mln
+141.239 Mln
18.78%
1 gen 2014 anni
253.367 Mln
-640.113 Mln
-71.64%
1 gen 2015 anni
410.011 Mln
+156.644 Mln
61.82%
Classificazione dei paesi secondo i statistiche attuali per anni