Download Queste statistiche in altri paesi:
Linea del tempo:
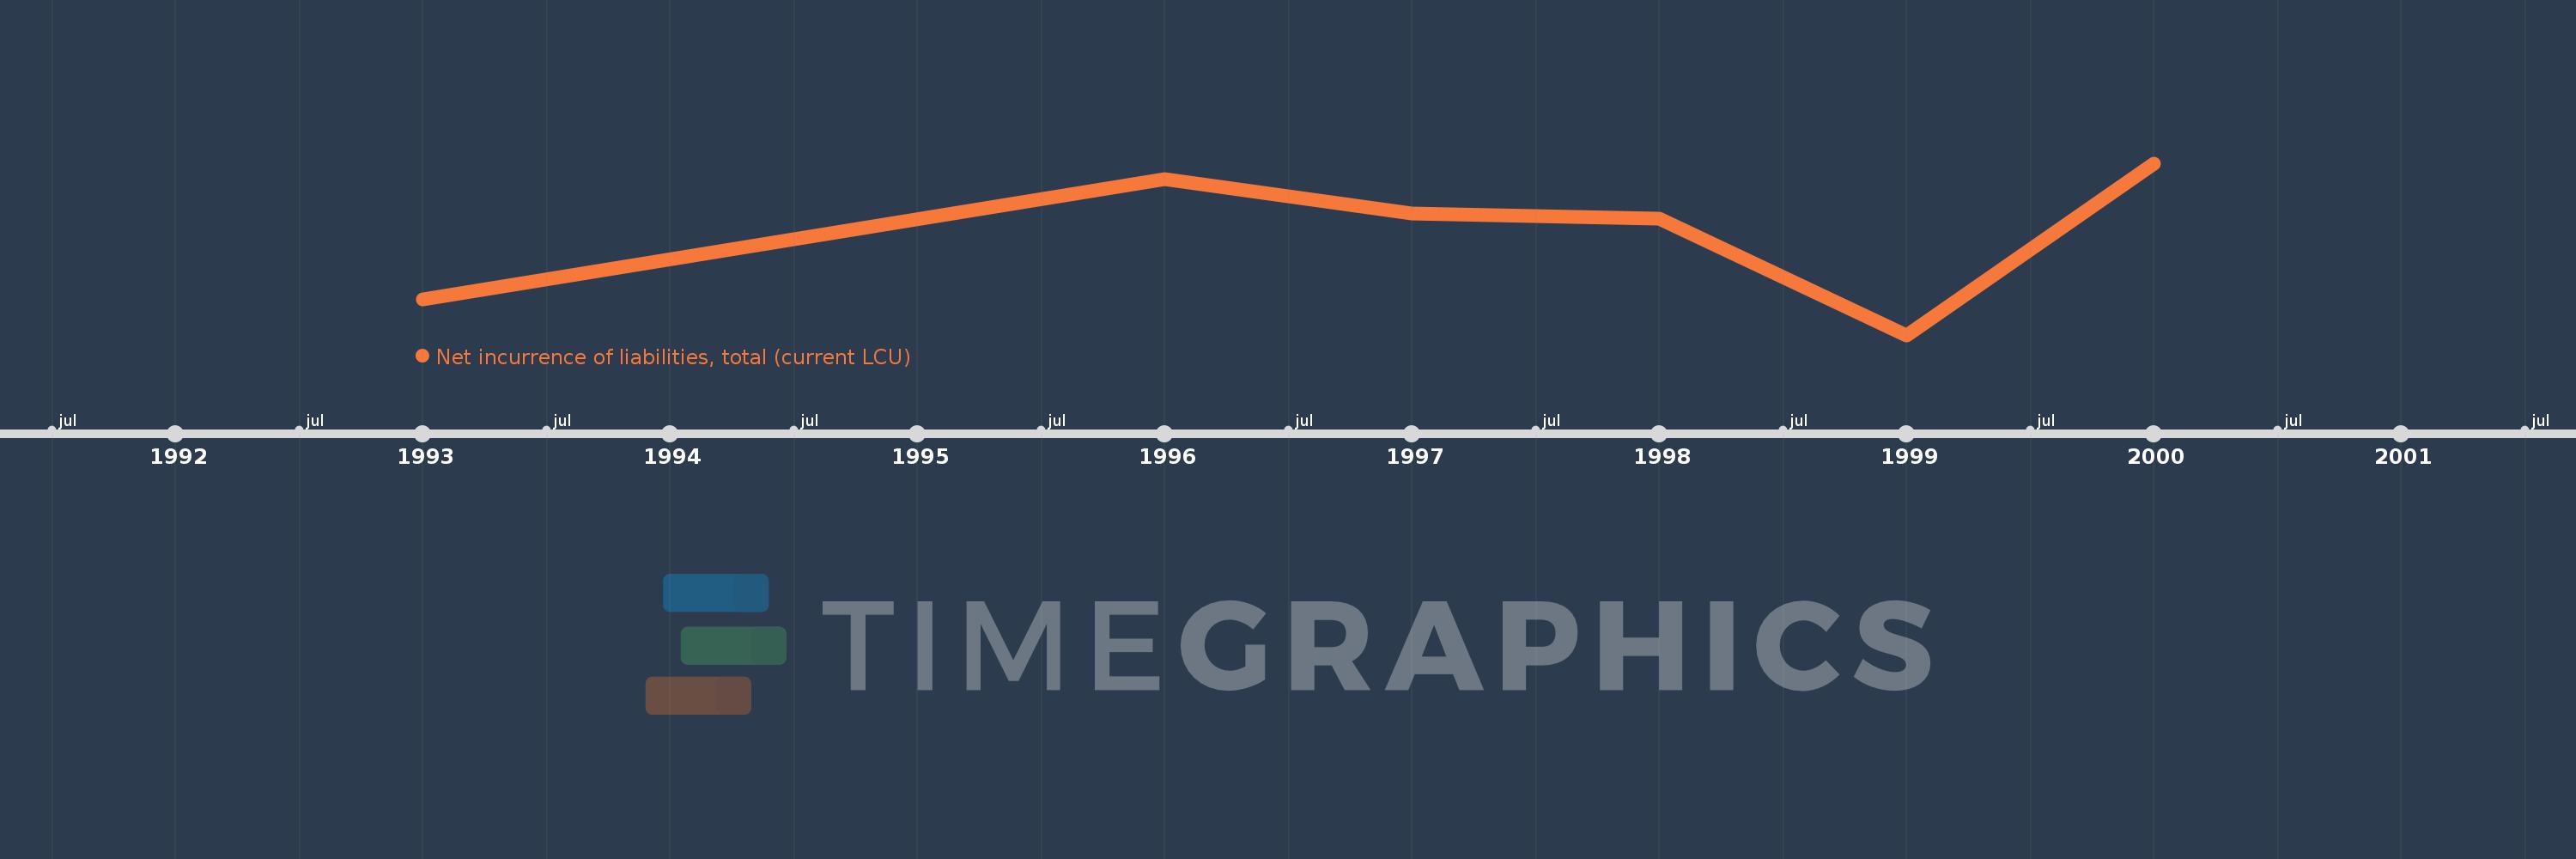
Questa scala temporale mostra un grafico dal 1993 anno al 2000 anno. Estonia. I dati fino ad 1992 anno non disponibili. Il numero di osservazioni attuali secondo i date: 6.
La fonte (nome):
Indicatori dello sviluppo mondiale
La fonte (organizzazione):
International Monetary Fund, Government Finance Statistics Yearbook and data files.
Categorie:
Public Sector
sono stati aggiornati
23 apr 2017 anni
Indicatori delle variazioni dei valori per anni
Minima:
-1.086 Mln
1 gen 1999 anni
Massimo:
4.372 Mln
1 gen 2000 anni
Alla data di osservazione
Valore
Variazione assoluta
La variazione rispetto al valore precedente
1 gen 1993 anni
35.945 Mille.
+35.945 Mille.
0.0%
1 gen 1996 anni
3.879 Mln
+3.843 Mln
10.69 Mille.%
1 gen 1997 anni
2.767 Mln
-1.112 Mln
-28.67%
1 gen 1998 anni
2.62 Mln
-146.997 Mille.
-5.31%
1 gen 1999 anni
-1.086 Mln
-3.707 Mln
-141.46%
1 gen 2000 anni
4.372 Mln
+5.458 Mln
-502.35%
Classificazione dei paesi secondo i statistiche attuali per anni