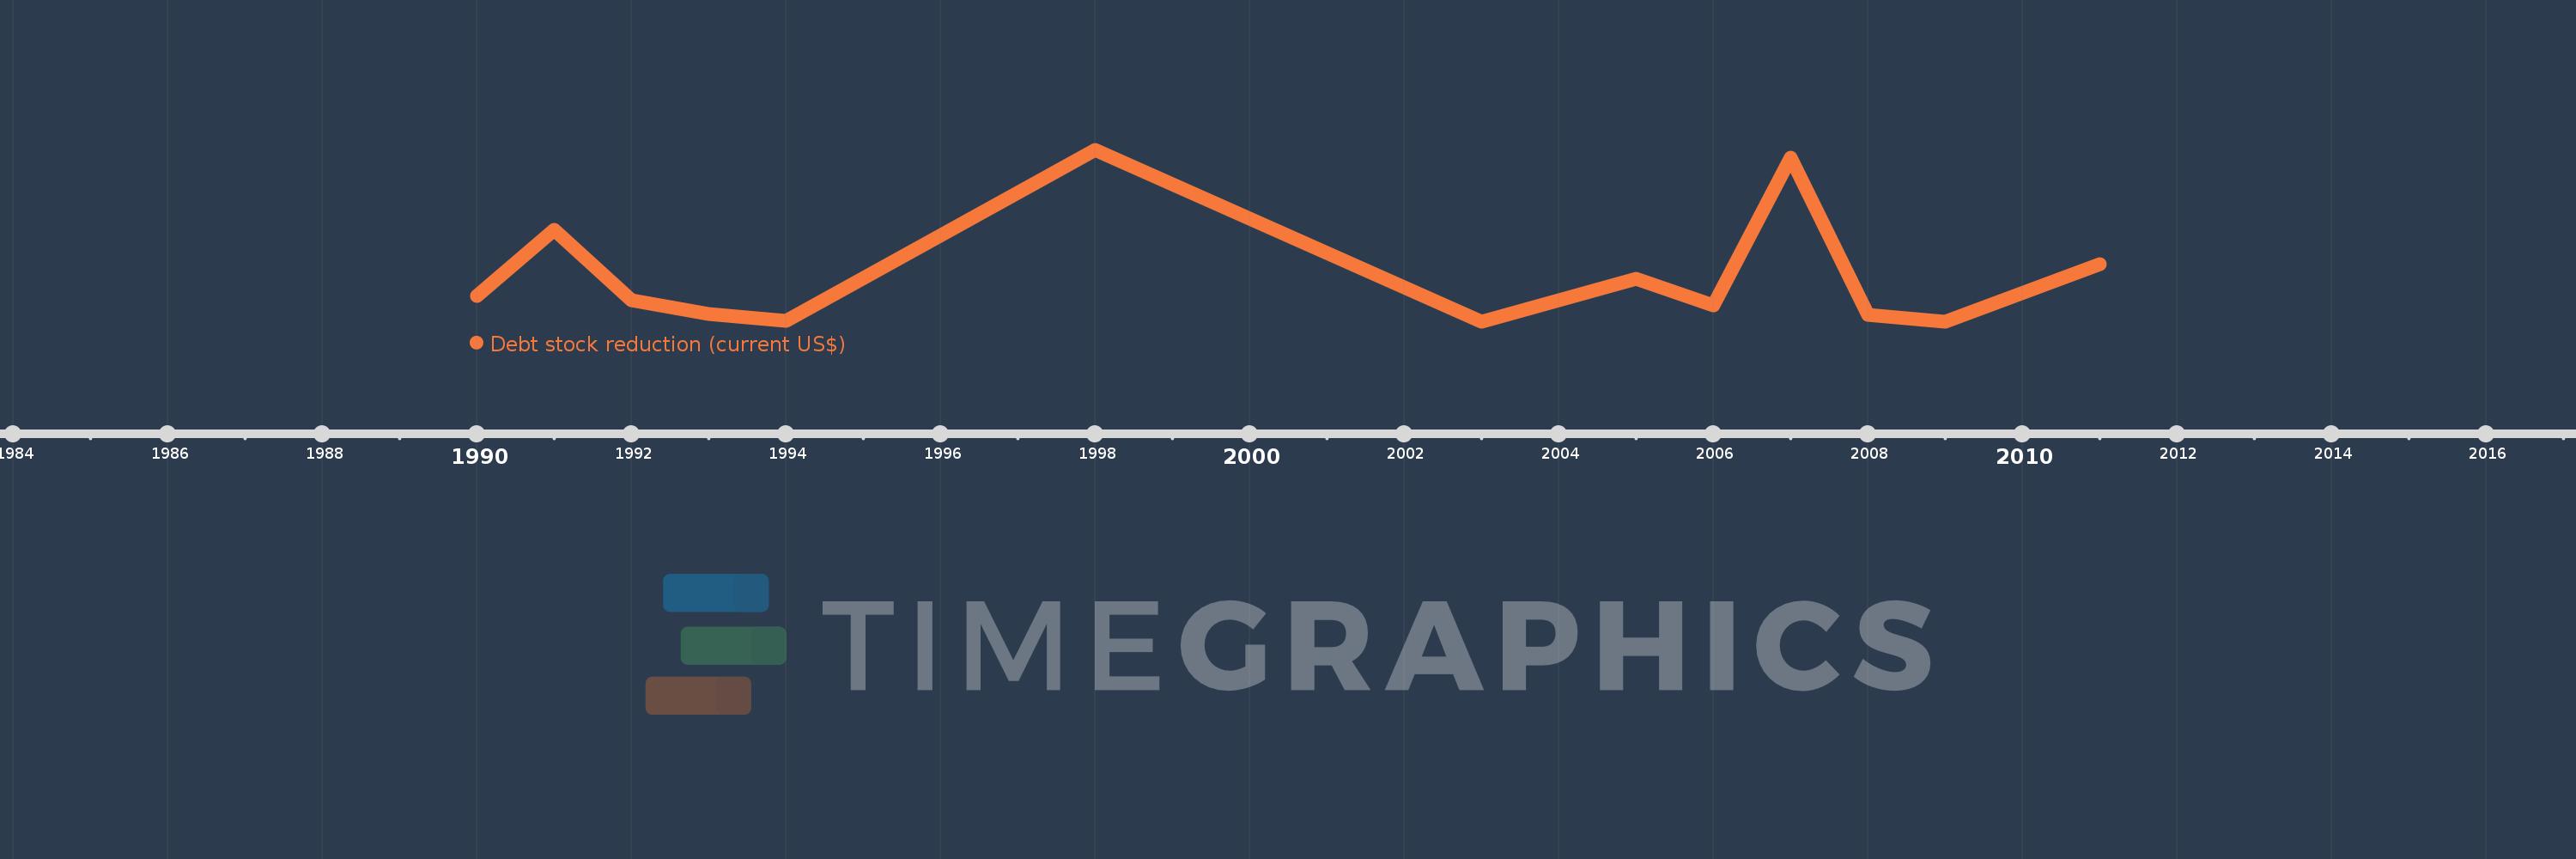
Questa scala temporale mostra un grafico dal 1990 anno al 2011 anno. Venezuela, RB. I dati fino ad 1989 anno non disponibili. Il numero di osservazioni attuali secondo i date: 13.
La fonte (nome):
Indicatori dello sviluppo mondiale
La fonte (organizzazione):
World Bank, International Debt Statistics.
Categorie:
External Debt
sono stati aggiornati
23 apr 2017 anni
Indicatori delle variazioni dei valori per anni
In media:
1.202 Mlrd
Minima:
0.0
1 gen 2003 anni
Massimo:
4.4 Mlrd
1 gen 1998 anni
Alla data di osservazione
Valore
Variazione assoluta
La variazione rispetto al valore precedente
1 gen 1990 anni
655.889 Mln
+655.889 Mln
0.0%
1 gen 1991 anni
2.361 Mlrd
+1.705 Mlrd
259.95%
1 gen 1992 anni
565.021 Mln
-1.796 Mlrd
-76.07%
1 gen 1993 anni
203.861 Mln
-361.16 Mln
-63.92%
1 gen 1994 anni
18.428 Mln
-185.433 Mln
-90.96%
1 gen 1998 anni
4.4 Mlrd
+4.382 Mlrd
23.78 Mille.%
1 gen 2003 anni
0.0
-4.4 Mlrd
-100.0%
1 gen 2005 anni
1.11 Mlrd
+1.11 Mlrd
%
1 gen 2006 anni
419.341 Mln
-690.605 Mln
-62.22%
1 gen 2007 anni
4.217 Mlrd
+3.798 Mlrd
905.63%
1 gen 2008 anni
177.091 Mln
-4.04 Mlrd
-95.8%
1 gen 2009 anni
4.017 Mln
-173.074 Mln
-97.73%
1 gen 2011 anni
1.49 Mlrd
+1.486 Mlrd
36.99 Mille.%
Classificazione dei paesi secondo i statistiche attuali per anni