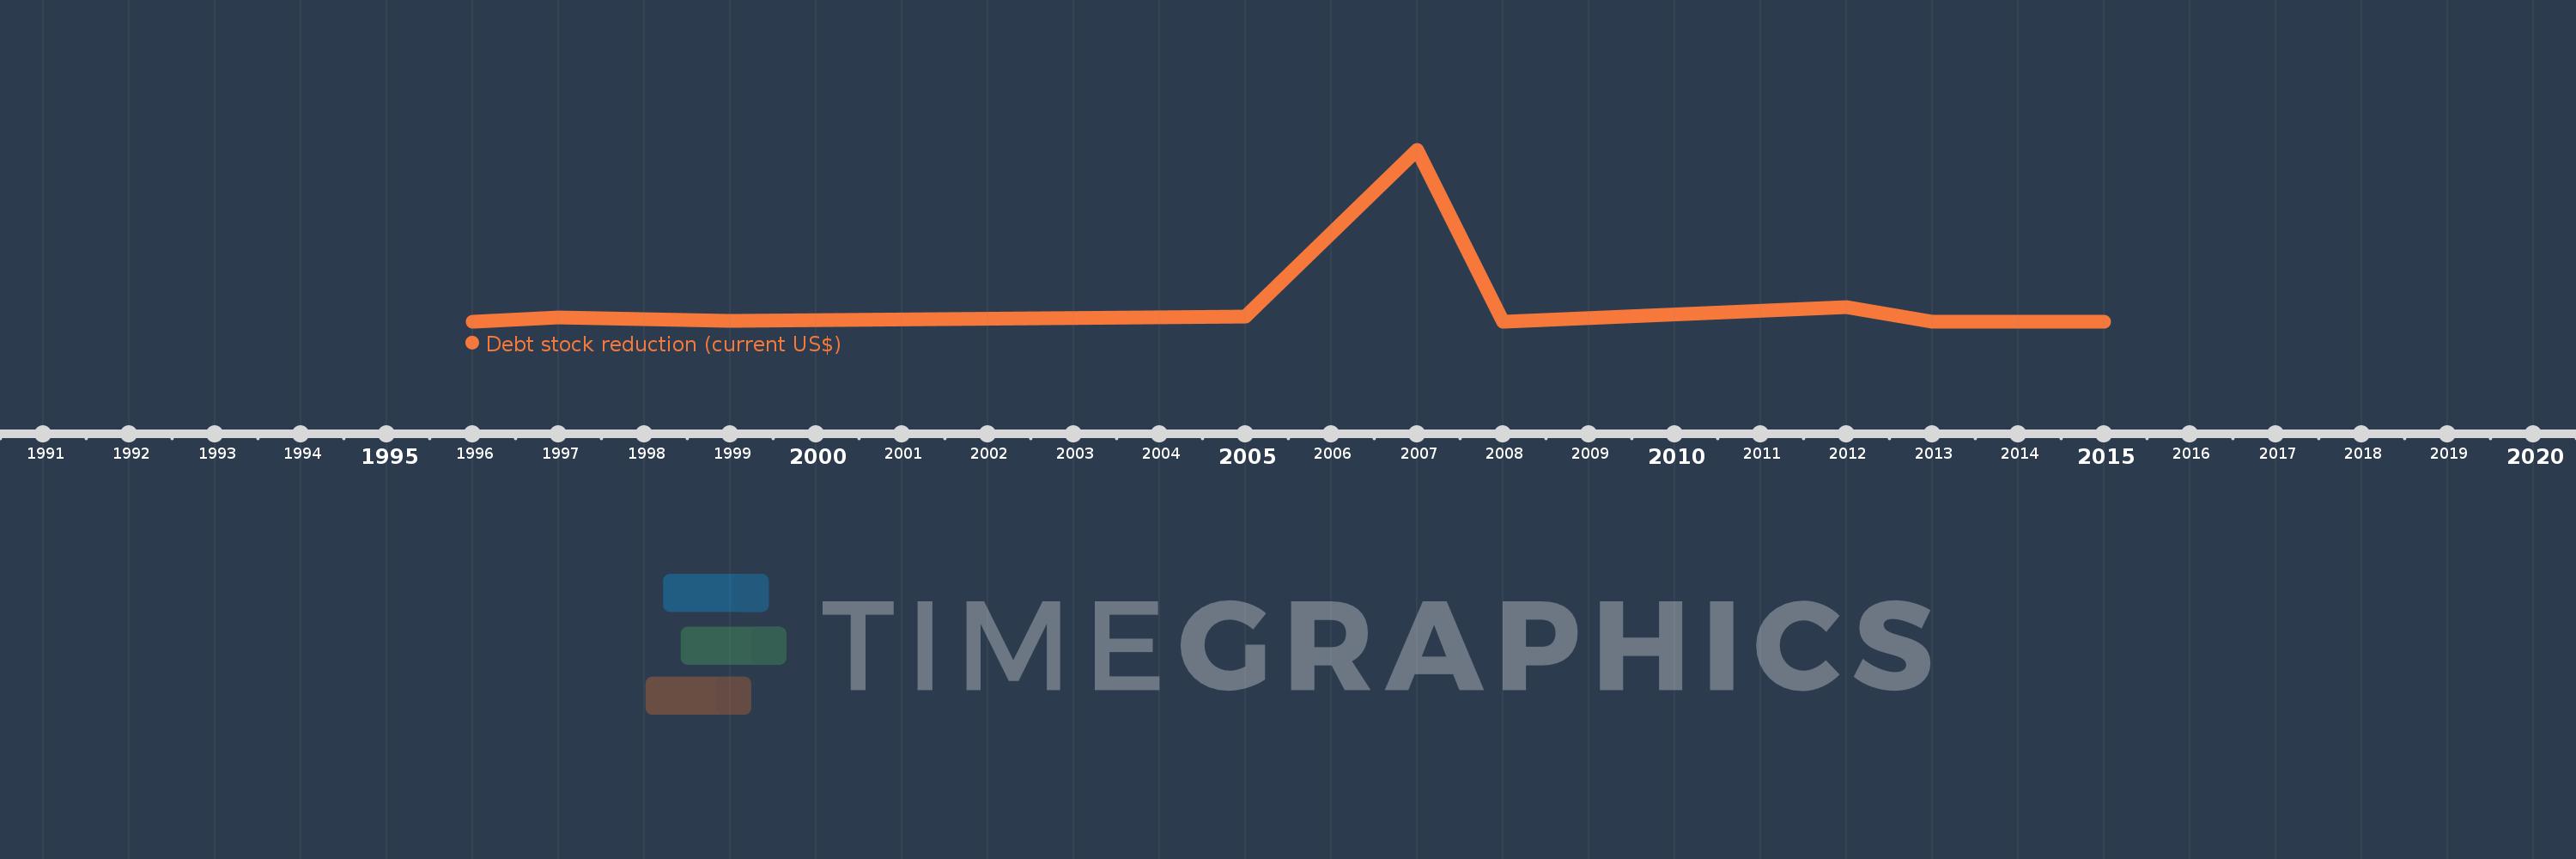
Questa scala temporale mostra un grafico dal 1996 anno al 2015 anno. Senegal. I dati fino ad 1995 anno non disponibili. Il numero di osservazioni attuali secondo i date: 9.
La fonte (nome):
Indicatori dello sviluppo mondiale
La fonte (organizzazione):
World Bank, International Debt Statistics.
Categorie:
External Debt
sono stati aggiornati
23 apr 2017 anni
Indicatori delle variazioni dei valori per anni
In media:
291.368 Mln
Minima:
0.0
1 gen 2013 anni
Massimo:
2.265 Mlrd
1 gen 2007 anni
Alla data di osservazione
Valore
Variazione assoluta
La variazione rispetto al valore precedente
1 gen 1996 anni
7.799 Mln
+7.799 Mln
0.0%
1 gen 1997 anni
64.465 Mln
+56.666 Mln
726.58%
1 gen 1999 anni
16.069 Mln
-48.396 Mln
-75.07%
1 gen 2005 anni
69.005 Mln
+52.936 Mln
329.43%
1 gen 2007 anni
2.265 Mlrd
+2.196 Mlrd
3.18 Mille.%
1 gen 2008 anni
1000.0
-2.265 Mlrd
-100.0%
1 gen 2012 anni
200.0 Mln
+199.999 Mln
20.0 Mln%
1 gen 2013 anni
0.0
-200.0 Mln
-100.0%
1 gen 2015 anni
0.0
0.0
%
Classificazione dei paesi secondo i statistiche attuali per anni