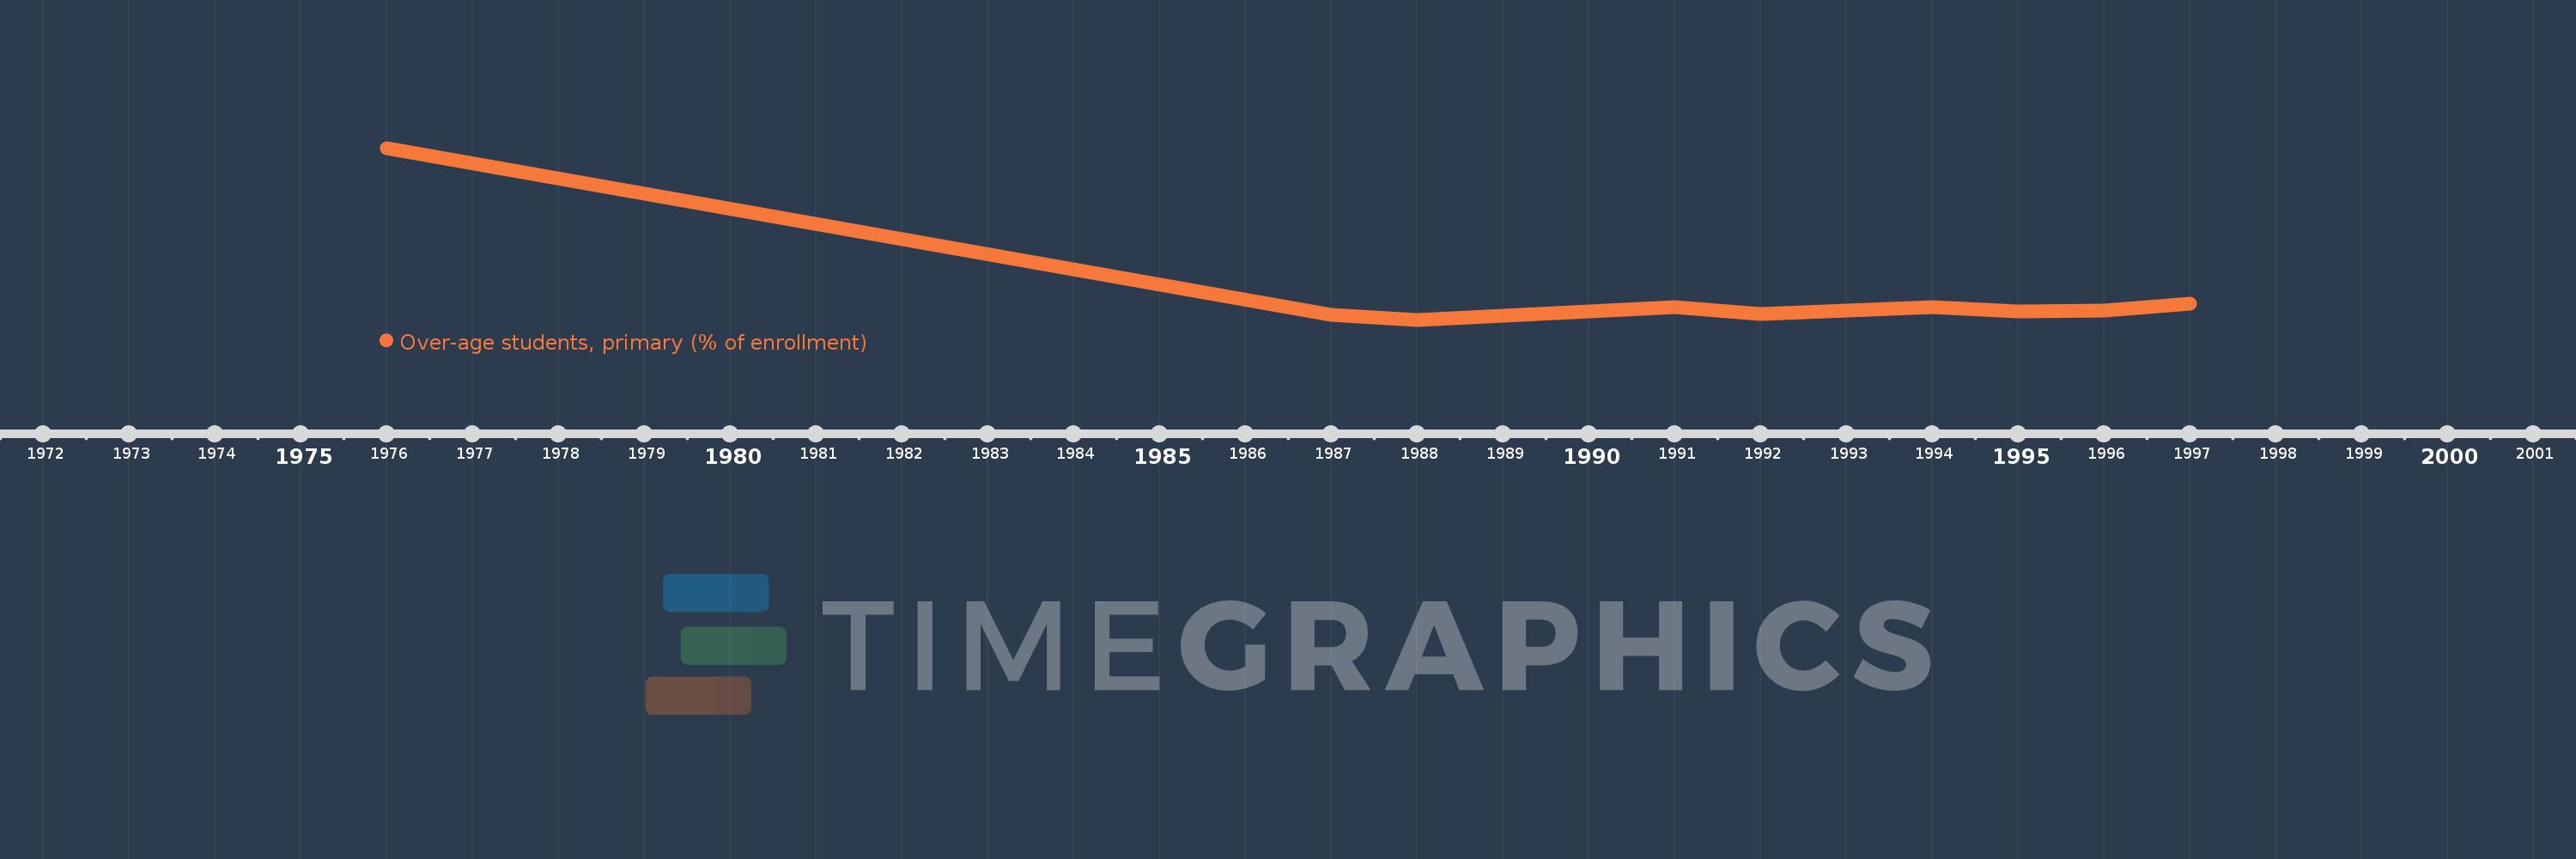
Questa scala temporale mostra un grafico dal 1976 anno al 1997 anno. United States. I dati fino ad 1975 anno non disponibili. Il numero di osservazioni attuali secondo i date: 9.
La fonte (nome):
Indicatori dello sviluppo mondiale
La fonte (organizzazione):
United Nations Educational, Scientific, and Cultural Organization (UNESCO) Institute for Statistics.
Categorie:
Education
sono stati aggiornati
23 apr 2017 anni
Indicatori delle variazioni dei valori per anni
In media:
6.759
Minima:
4.982
1 gen 1988 anni
Massimo:
16.32
1 gen 1976 anni
Alla data di osservazione
Valore
Variazione assoluta
La variazione rispetto al valore precedente
1 gen 1976 anni
16.32
+16.32
0.0%
1 gen 1987 anni
5.328
-10.992
-67.35%
1 gen 1988 anni
4.982
-0.346
-6.5%
1 gen 1991 anni
5.799
+0.817
16.41%
1 gen 1992 anni
5.381
-0.418
-7.2%
1 gen 1994 anni
5.836
+0.455
8.45%
1 gen 1995 anni
5.532
-0.304
-5.21%
1 gen 1996 anni
5.583
+0.051
0.93%
1 gen 1997 anni
6.065
+0.482
8.63%
Classificazione dei paesi secondo i statistiche attuali per anni