29
/it/
it
AIzaSyAYiBZKx7MnpbEhh9jyipgxe19OcubqV5w
April 1, 2024
172065
Kuwait
KWT
true
2
1
Over-age students, primary (% of enrollment)
1998,1997,1995,1993,1989,1988,1987,1986,1985,1984,1983,1982,1981,1980,1979,1978,1977,1976,1975,1974,1973,1972
Download
Biblioteca di statistiche globali →Kuwait →

Over-age students, primary (% of enrollment)

Queste statistiche in altri paesi:
AfghanistanAlbaniaAlgeriaAndorraAngolaAntigua and BarbudaArgentinaArubaAustraliaAustriaAzerbaijanBahamas, TheBahrainBangladeshBarbadosBelarusBelgiumBelizeBeninBermudaBhutanBoliviaBosnia and HerzegovinaBotswanaBrazilBritish Virgin IslandsBrunei DarussalamBulgariaBurkina FasoBurundiCabo VerdeCambodiaCameroonCanadaCentral African RepublicChadChileChinaColombiaComorosCongo, Dem. Rep.Congo, Rep.Costa RicaCote d'IvoireCubaCyprusDenmarkDjiboutiDominicaDominican RepublicEcuadorEgypt, Arab Rep.El SalvadorEquatorial GuineaEritreaEstoniaEthiopiaFijiFinlandFranceGabonGambia, TheGeorgiaGermanyGhanaGreeceGrenadaGuatemalaGuineaGuinea-BissauGuyanaHaitiHondurasHong Kong SAR, ChinaHungaryIcelandIndiaIndonesiaIran, Islamic Rep.IraqIrelandItalyJamaicaJapanJordanKazakhstanKenyaKiribatiKorea, Dem. People’s Rep.Korea, Rep.KuwaitKyrgyz RepublicLao PDRLebanonLesothoLibyaLuxembourgMacao SAR, ChinaMadagascarMalawiMalaysiaMaldivesMaliMaltaMarshall IslandsMauritaniaMauritiusMexicoMoldovaMongoliaMontenegroMoroccoMozambiqueMyanmarNamibiaNepalNetherlandsNew ZealandNicaraguaNigerNorwayOmanPakistanPalauPanamaParaguayPeruPhilippinesPolandPortugalPuerto RicoQatarRussian FederationRwandaSamoaSan MarinoSao Tome and PrincipeSaudi ArabiaSenegalSerbiaSeychellesSierra LeoneSingaporeSint Maarten (Dutch part)SloveniaSolomon IslandsSomaliaSouth AfricaSouth SudanSpainSri LankaSt. Kitts and NevisSt. LuciaSt. Vincent and the GrenadinesSurinameSwazilandSwedenSwitzerlandSyrian Arab RepublicTajikistanTanzaniaThailandTimor-LesteTogoTongaTrinidad and TobagoTunisiaTurkeyTurks and Caicos IslandsTuvaluUgandaUkraineUnited Arab EmiratesUnited KingdomUnited StatesUruguayVanuatuVenezuela, RBVietnamZambiaZimbabwe
Linea del tempo:
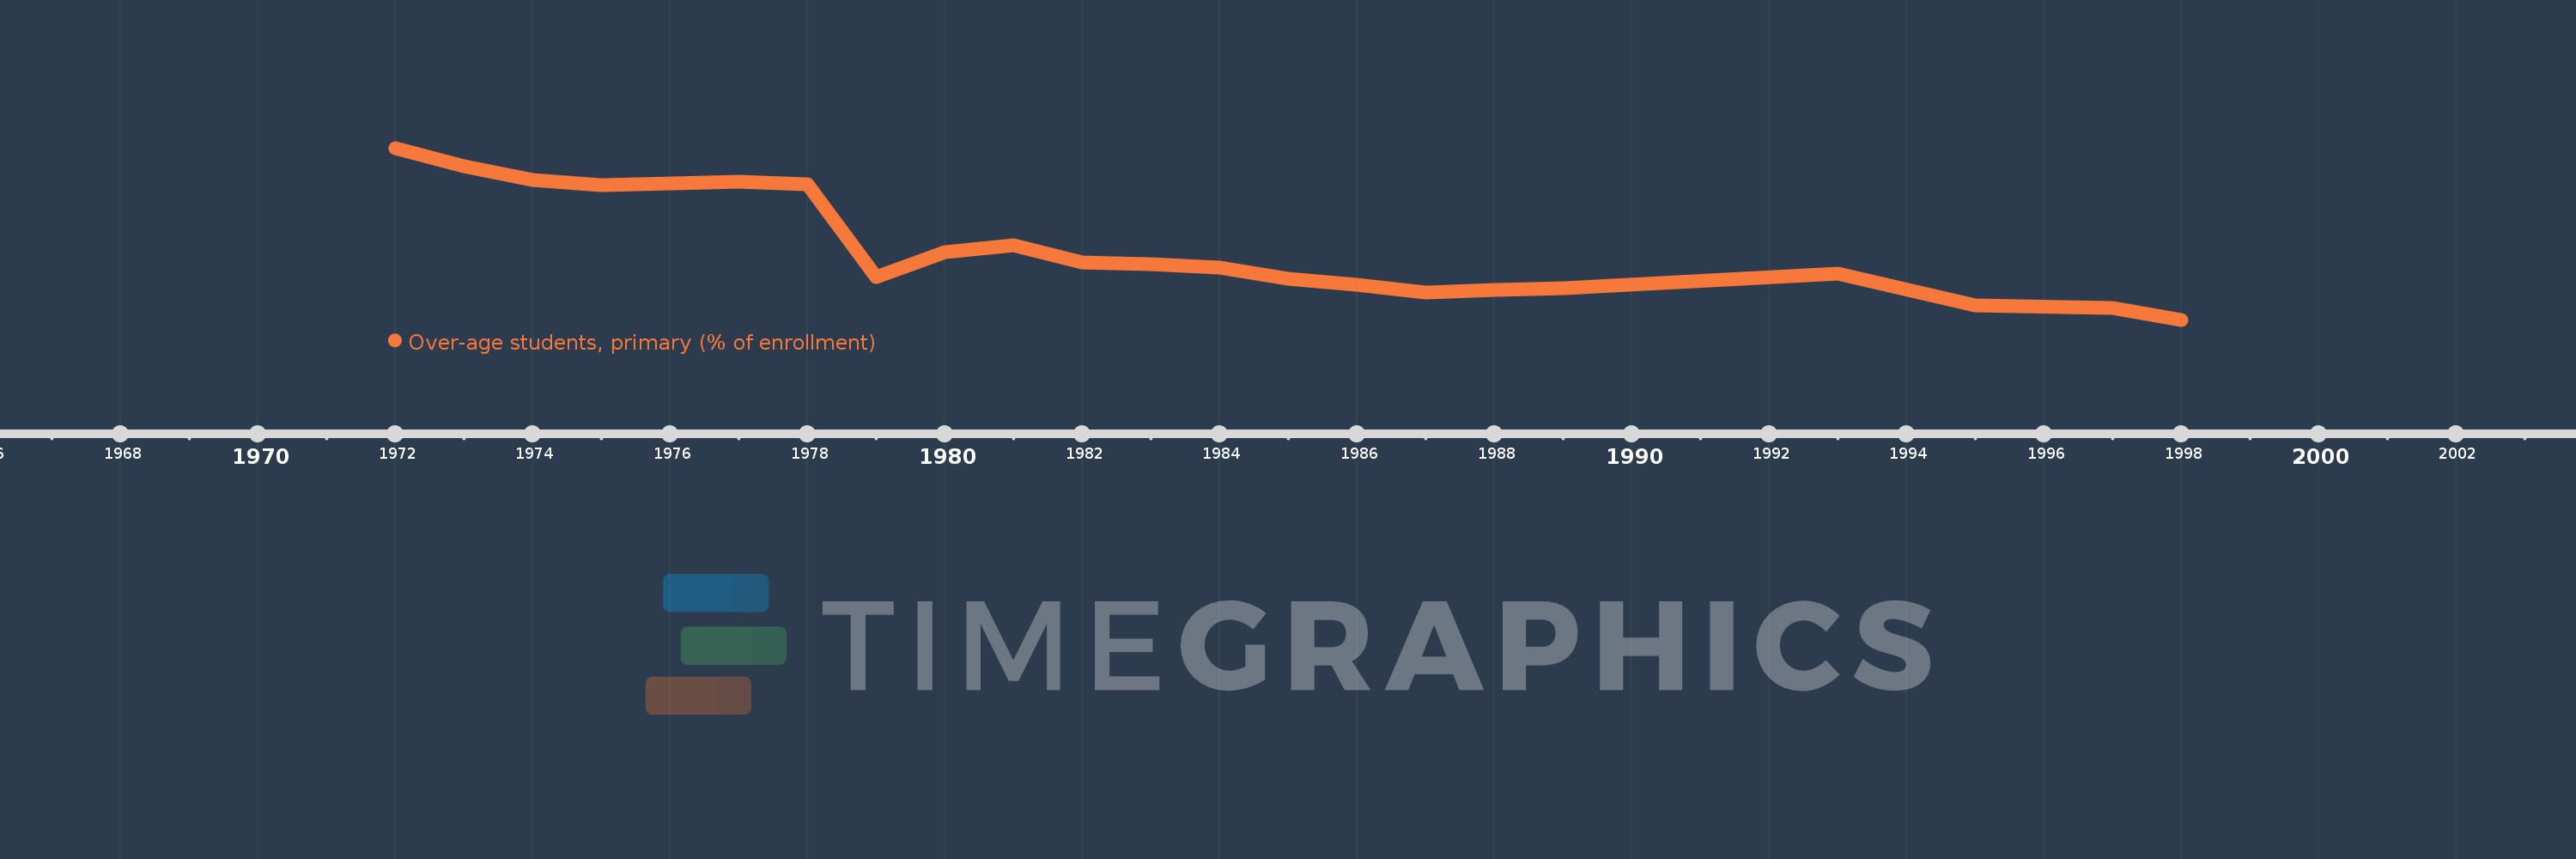
Questa scala temporale mostra un grafico dal 1972 anno al 1998 anno. Kuwait. I dati fino ad 1971 anno non disponibili. Il numero di osservazioni attuali secondo i date: 22.
La fonte (nome):
Indicatori dello sviluppo mondiale
La fonte (organizzazione):
United Nations Educational, Scientific, and Cultural Organization (UNESCO) Institute for Statistics.
Categorie:
Education
sono stati aggiornati
23 apr 2017 anni
Indicatori delle variazioni dei valori per anni
In media:
16.0
Minima:
5.085
1 gen 1998 anni
Massimo:
30.928
1 gen 1972 anni
Alla data di osservazione
Valore
Variazione assoluta
La variazione rispetto al valore precedente
1 gen 1972 anni
30.928
+30.928
0.0%
1 gen 1973 anni
28.163
-2.765
-8.94%
1 gen 1974 anni
26.05
-2.113
-7.5%
1 gen 1975 anni
25.319
-0.731
-2.81%
1 gen 1976 anni
25.557
+0.237
0.94%
1 gen 1977 anni
25.839
+0.282
1.1%
1 gen 1978 anni
25.494
-0.345
-1.33%
1 gen 1979 anni
11.569
-13.925
-54.62%
1 gen 1980 anni
15.259
+3.69
31.9%
1 gen 1981 anni
16.278
+1.019
6.68%
1 gen 1982 anni
13.697
-2.581
-15.86%
1 gen 1983 anni
13.448
-0.249
-1.82%
1 gen 1984 anni
12.877
-0.571
-4.24%
1 gen 1985 anni
11.234
-1.644
-12.76%
1 gen 1986 anni
10.385
-0.849
-7.56%
1 gen 1987 anni
9.216
-1.169
-11.26%
1 gen 1988 anni
9.571
+0.356
3.86%
1 gen 1989 anni
9.799
+0.227
2.37%
1 gen 1993 anni
12.01
+2.211
22.56%
1 gen 1995 anni
7.303
-4.706
-39.19%
1 gen 1997 anni
6.91
-0.393
-5.39%
1 gen 1998 anni
5.085
-1.825
-26.41%
Classificazione dei paesi secondo i statistiche attuali per anni

Commenti:

Inviare
PremiumAbout & FeedbackAccordoPrivatezza
logo
© 2022 Selected Technologies LLC – Morgan Hill, California