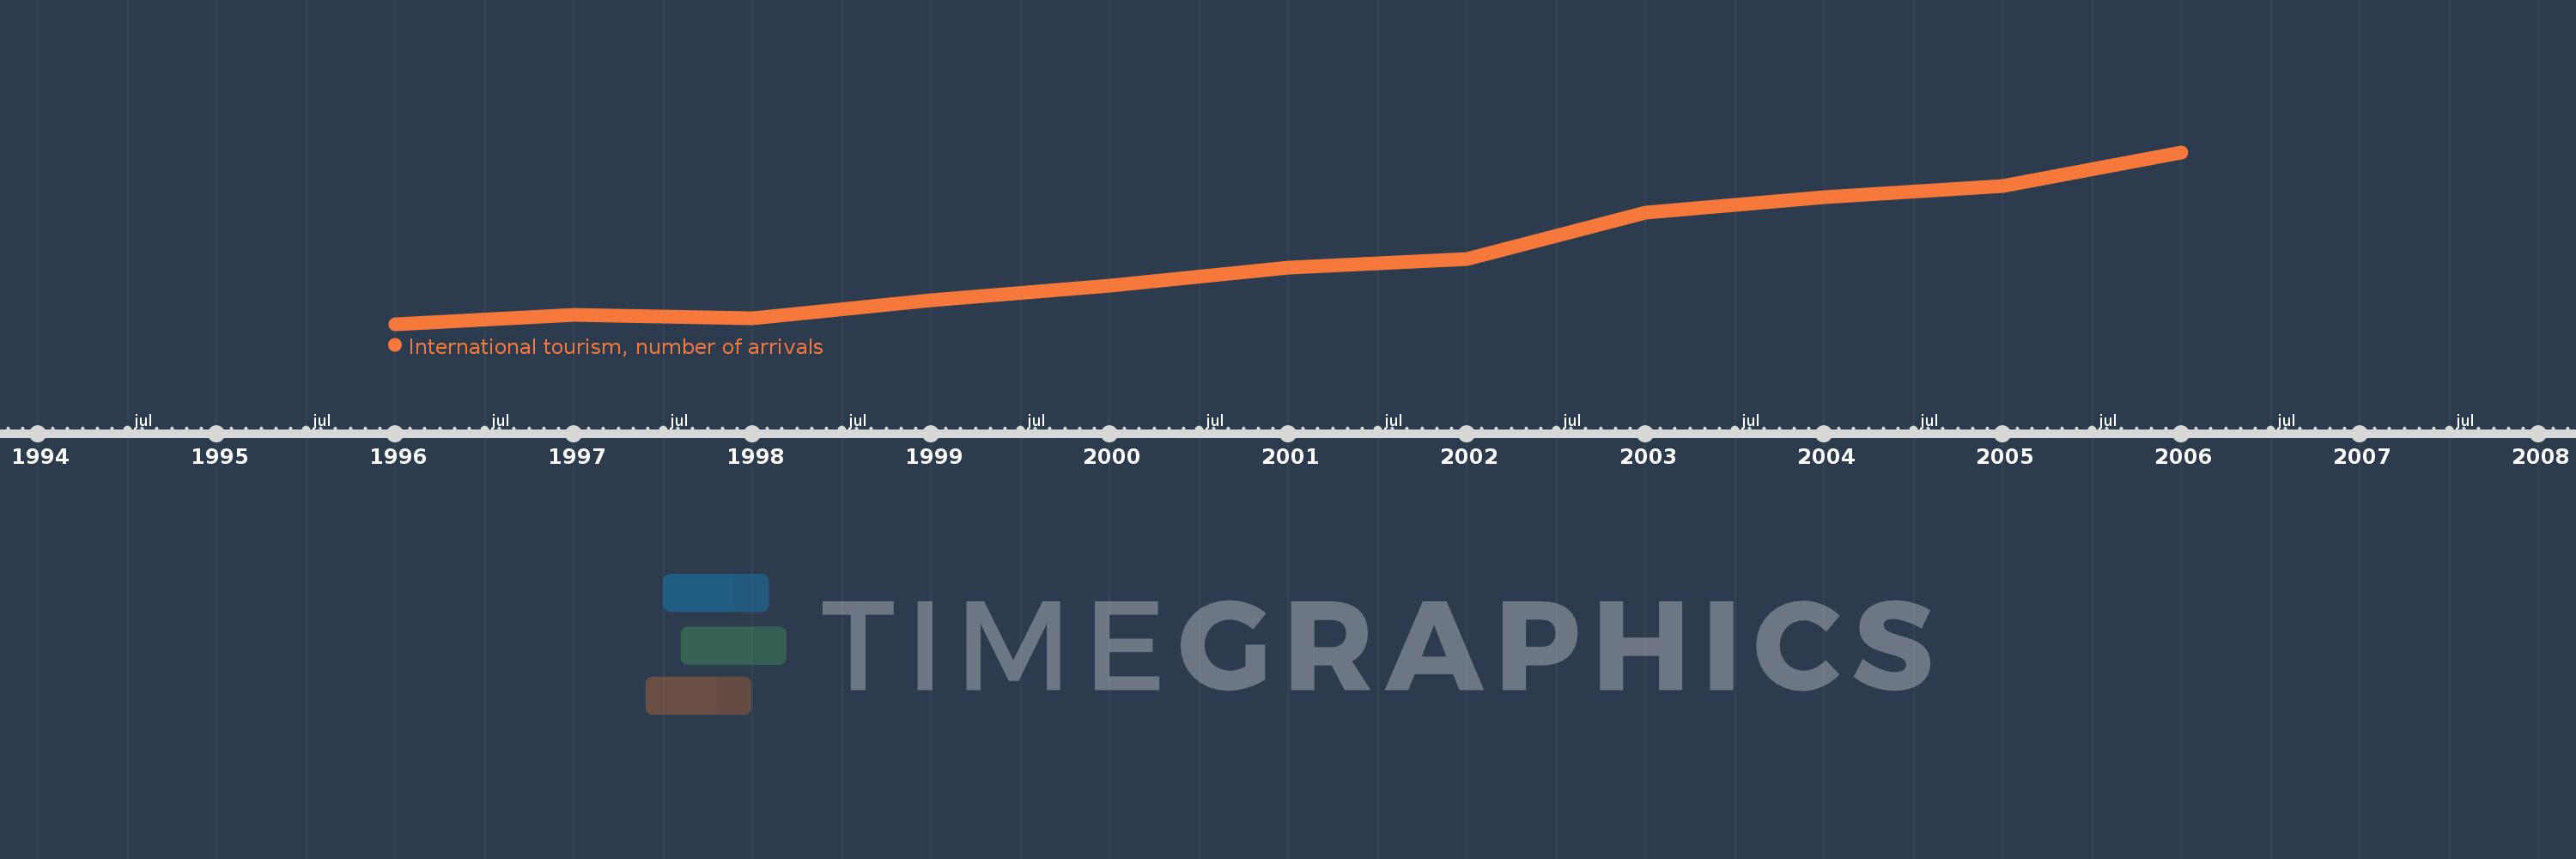
Questa scala temporale mostra un grafico dal 1996 anno al 2006 anno. United Arab Emirates. I dati fino ad 1995 anno non disponibili. Il numero di osservazioni attuali secondo i date: 11.
La fonte (nome):
Indicatori dello sviluppo mondiale
La fonte (organizzazione):
World Tourism Organization, Yearbook of Tourism Statistics, Compendium of Tourism Statistics and data files.
Categorie:
Private Sector, Trade
sono stati aggiornati
23 apr 2017 anni
Indicatori delle variazioni dei valori per anni
In media:
4.22 Mln
Minima:
2.315 Mln
1 gen 1996 anni
Massimo:
7.126 Mln
1 gen 2006 anni
Alla data di osservazione
Valore
Variazione assoluta
La variazione rispetto al valore precedente
1 gen 1996 anni
2.315 Mln
+2.315 Mln
0.0%
1 gen 1997 anni
2.572 Mln
+257.0 Mille.
11.1%
1 gen 1998 anni
2.476 Mln
-96.0 Mille.
-3.73%
1 gen 1999 anni
2.991 Mln
+515.0 Mille.
20.8%
1 gen 2000 anni
3.393 Mln
+402.0 Mille.
13.44%
1 gen 2001 anni
3.907 Mln
+514.0 Mille.
15.15%
1 gen 2002 anni
4.134 Mln
+227.0 Mille.
5.81%
1 gen 2003 anni
5.445 Mln
+1.311 Mln
31.71%
1 gen 2004 anni
5.871 Mln
+426.0 Mille.
7.82%
1 gen 2005 anni
6.195 Mln
+324.0 Mille.
5.52%
1 gen 2006 anni
7.126 Mln
+931.0 Mille.
15.03%
Classificazione dei paesi secondo i statistiche attuali per anni