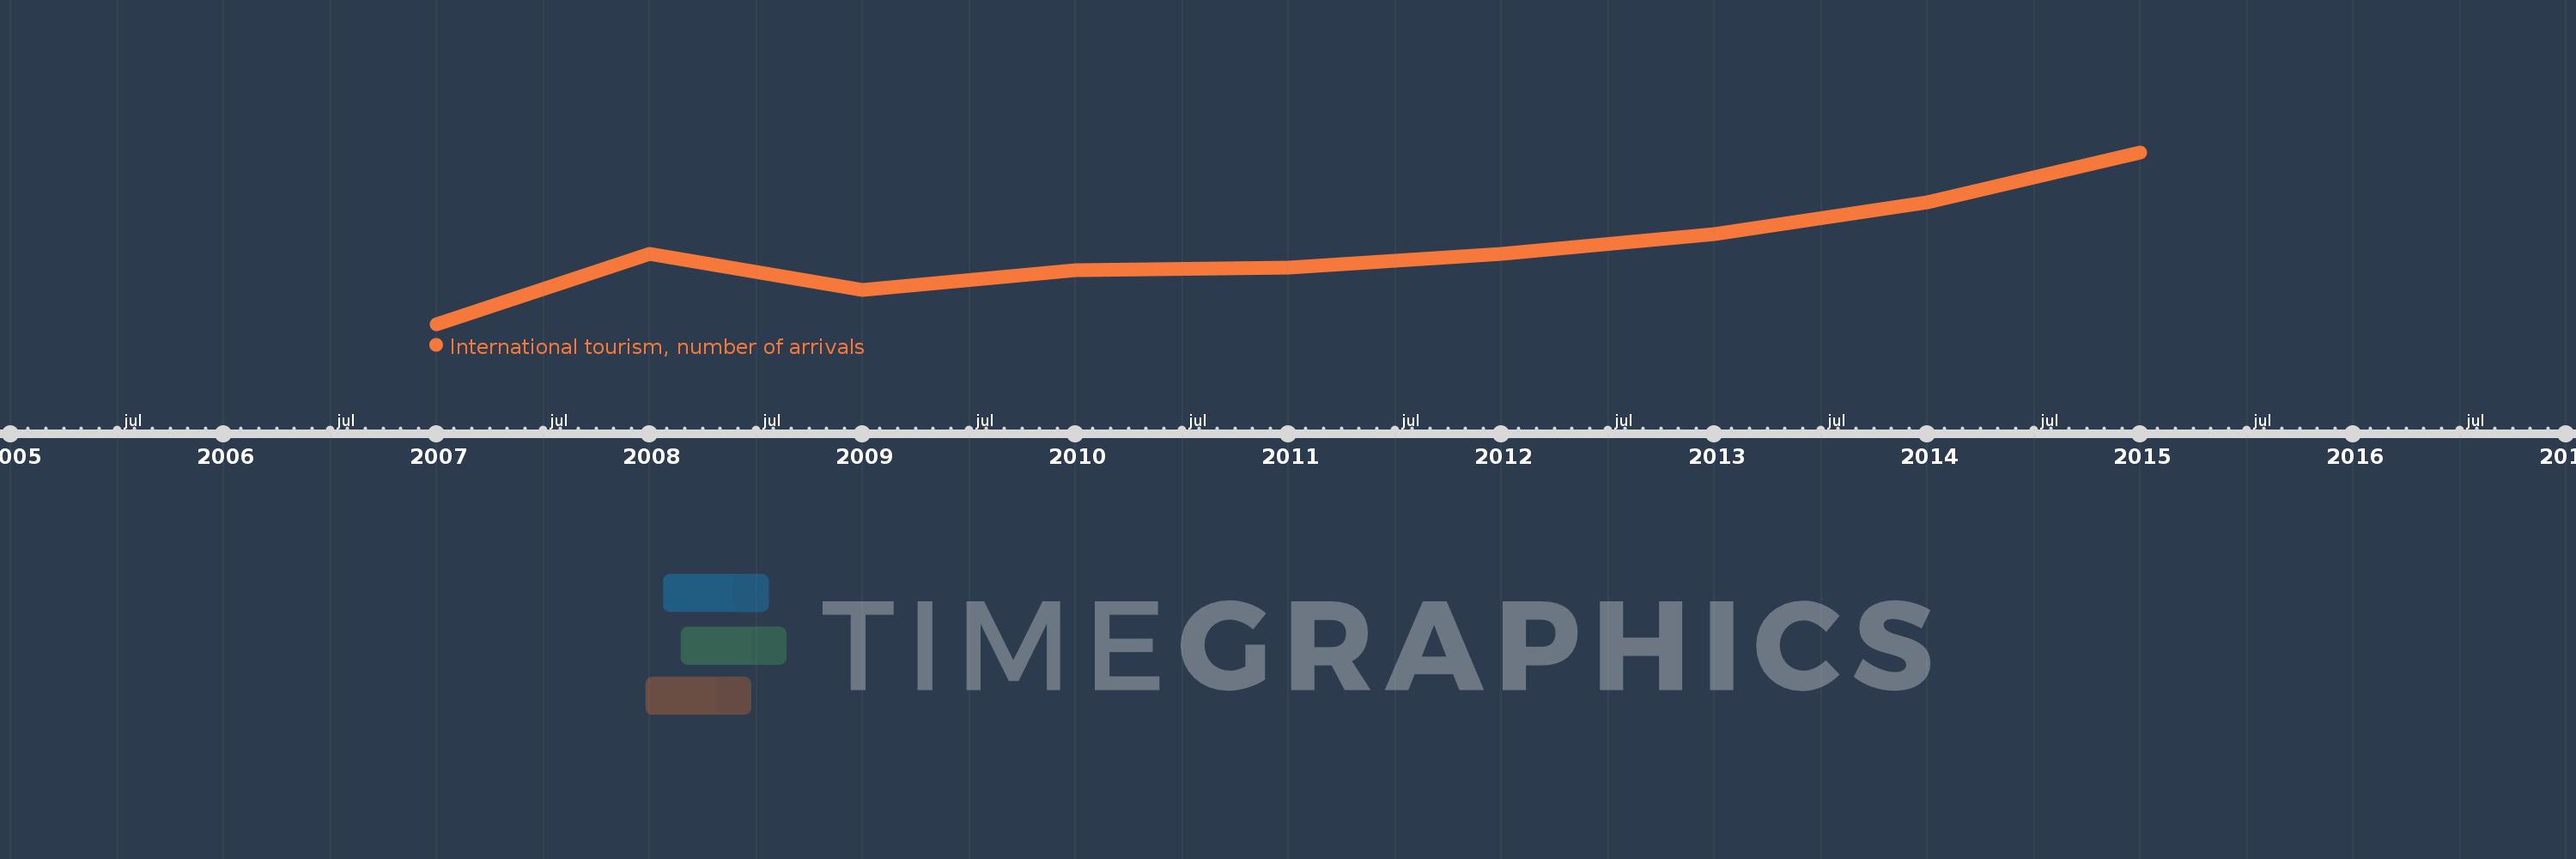
Questa scala temporale mostra un grafico dal 2007 anno al 2015 anno. Chad. I dati fino ad 2006 anno non disponibili. Il numero di osservazioni attuali secondo i date: 9.
La fonte (nome):
Indicatori dello sviluppo mondiale
La fonte (organizzazione):
World Tourism Organization, Yearbook of Tourism Statistics, Compendium of Tourism Statistics and data files.
Categorie:
Private Sector, Trade
sono stati aggiornati
23 apr 2017 anni
Indicatori delle variazioni dei valori per anni
In media:
78.889 Mille.
Minima:
46.0 Mille.
1 gen 2007 anni
Massimo:
122.0 Mille.
1 gen 2015 anni
Alla data di osservazione
Valore
Variazione assoluta
La variazione rispetto al valore precedente
1 gen 2007 anni
46.0 Mille.
+46.0 Mille.
0.0%
1 gen 2008 anni
77.0 Mille.
+31.0 Mille.
67.39%
1 gen 2009 anni
61.0 Mille.
-16.0 Mille.
-20.78%
1 gen 2010 anni
70.0 Mille.
+9.0 Mille.
14.75%
1 gen 2011 anni
71.0 Mille.
+1000.0
1.43%
1 gen 2012 anni
77.0 Mille.
+6.0 Mille.
8.45%
1 gen 2013 anni
86.0 Mille.
+9.0 Mille.
11.69%
1 gen 2014 anni
100.0 Mille.
+14.0 Mille.
16.28%
1 gen 2015 anni
122.0 Mille.
+22.0 Mille.
22.0%
Classificazione dei paesi secondo i statistiche attuali per anni