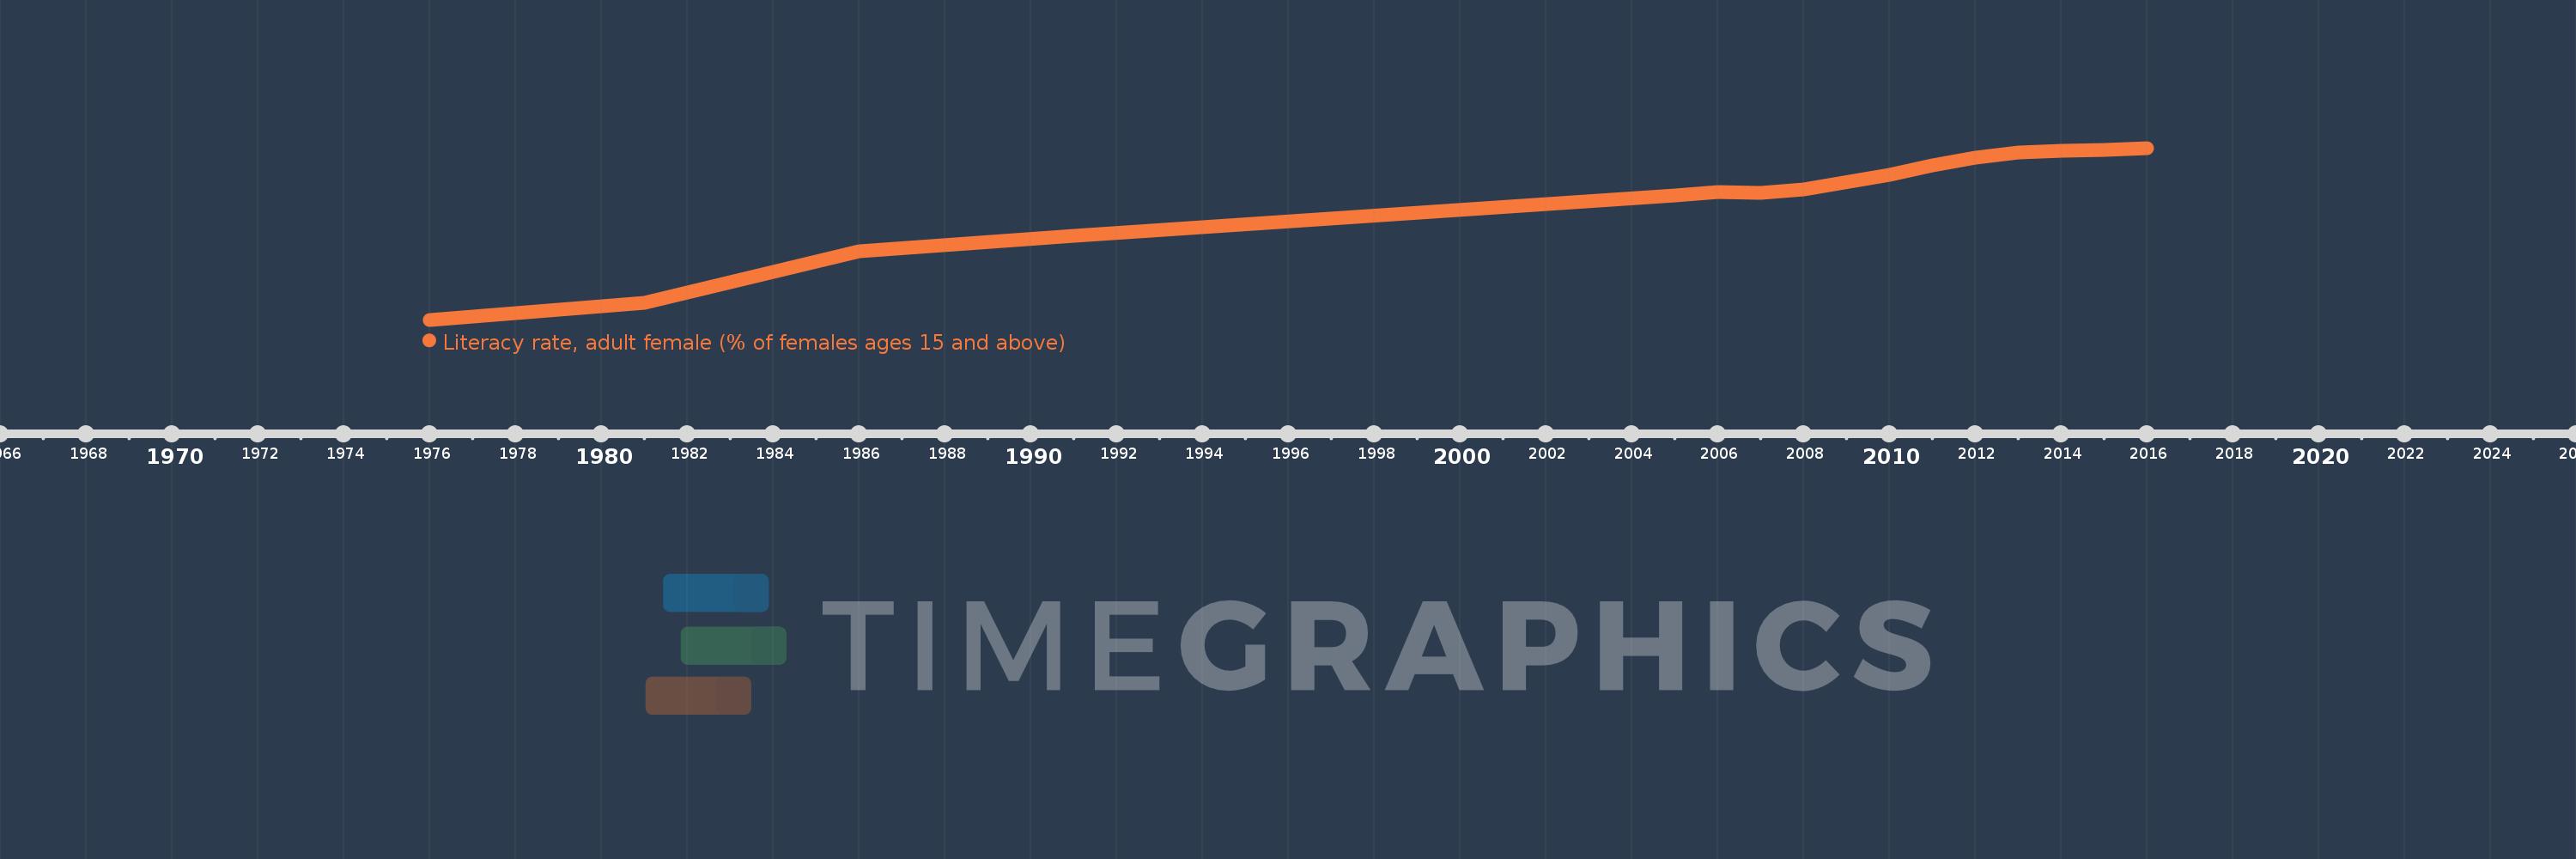
Questa scala temporale mostra un grafico dal 1976 anno al 2016 anno. Turkey. I dati fino ad 1975 anno non disponibili. Il numero di osservazioni attuali secondo i date: 15.
La fonte (nome):
Indicatori dello sviluppo mondiale
La fonte (organizzazione):
United Nations Educational, Scientific, and Cultural Organization (UNESCO) Institute for Statistics.
Categorie:
Gender, Education
sono stati aggiornati
23 apr 2017 anni
Indicatori delle variazioni dei valori per anni
In media:
78.814
Minima:
45.099
1 gen 1976 anni
Massimo:
92.901
1 gen 2016 anni
Alla data di osservazione
Valore
Variazione assoluta
La variazione rispetto al valore precedente
1 gen 1976 anni
45.099
+45.099
0.0%
1 gen 1981 anni
49.806
+4.707
10.44%
1 gen 1986 anni
64.232
+14.425
28.96%
1 gen 1991 anni
68.52
+4.288
6.68%
1 gen 2005 anni
79.582
+11.062
16.14%
1 gen 2006 anni
80.549
+0.967
1.22%
1 gen 2007 anni
80.385
-0.164
-0.2%
1 gen 2008 anni
81.264
+0.879
1.09%
1 gen 2010 anni
85.347
+4.083
5.02%
1 gen 2011 anni
88.073
+2.726
3.19%
1 gen 2012 anni
90.31
+2.237
2.54%
1 gen 2013 anni
91.605
+1.294
1.43%
1 gen 2014 anni
92.138
+0.534
0.58%
1 gen 2015 anni
92.402
+0.264
0.29%
1 gen 2016 anni
92.901
+0.499
0.54%
Classificazione dei paesi secondo i statistiche attuali per anni