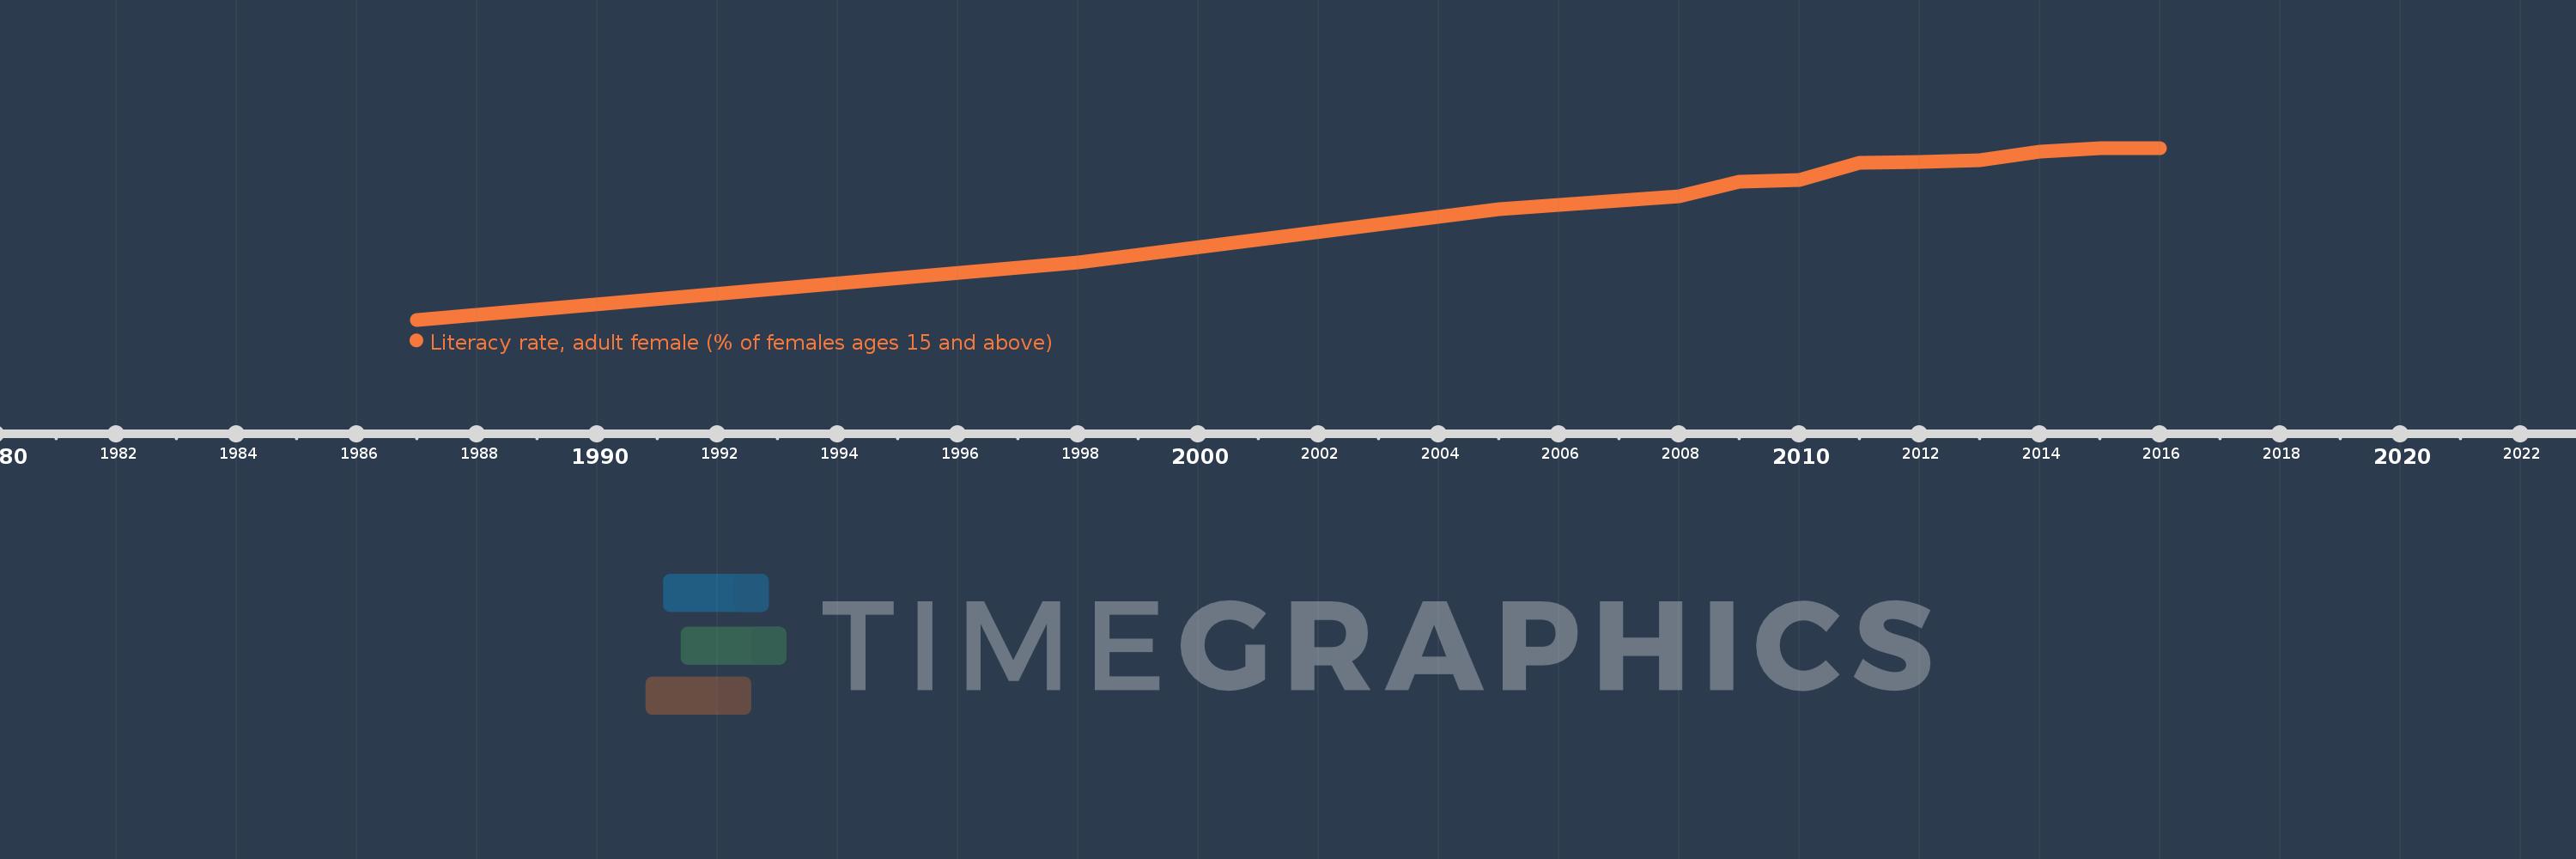
Questa scala temporale mostra un grafico dal 1987 anno al 2016 anno. Qatar. I dati fino ad 1986 anno non disponibili. Il numero di osservazioni attuali secondo i date: 12.
La fonte (nome):
Indicatori dello sviluppo mondiale
La fonte (organizzazione):
United Nations Educational, Scientific, and Cultural Organization (UNESCO) Institute for Statistics.
Categorie:
Gender, Education
sono stati aggiornati
23 apr 2017 anni
Indicatori delle variazioni dei valori per anni
In media:
91.404
Minima:
72.459
1 gen 1987 anni
Massimo:
97.558
1 gen 2015 anni
Alla data di osservazione
Valore
Variazione assoluta
La variazione rispetto al valore precedente
1 gen 1987 anni
72.459
+72.459
0.0%
1 gen 1998 anni
80.889
+8.43
11.63%
1 gen 2005 anni
88.609
+7.721
9.54%
1 gen 2008 anni
90.436
+1.827
2.06%
1 gen 2009 anni
92.664
+2.228
2.46%
1 gen 2010 anni
92.91
+0.246
0.27%
1 gen 2011 anni
95.402
+2.492
2.68%
1 gen 2012 anni
95.563
+0.161
0.17%
1 gen 2013 anni
95.774
+0.211
0.22%
1 gen 2014 anni
97.073
+1.299
1.36%
1 gen 2015 anni
97.558
+0.485
0.5%
1 gen 2016 anni
97.512
-0.046
-0.05%
Classificazione dei paesi secondo i statistiche attuali per anni