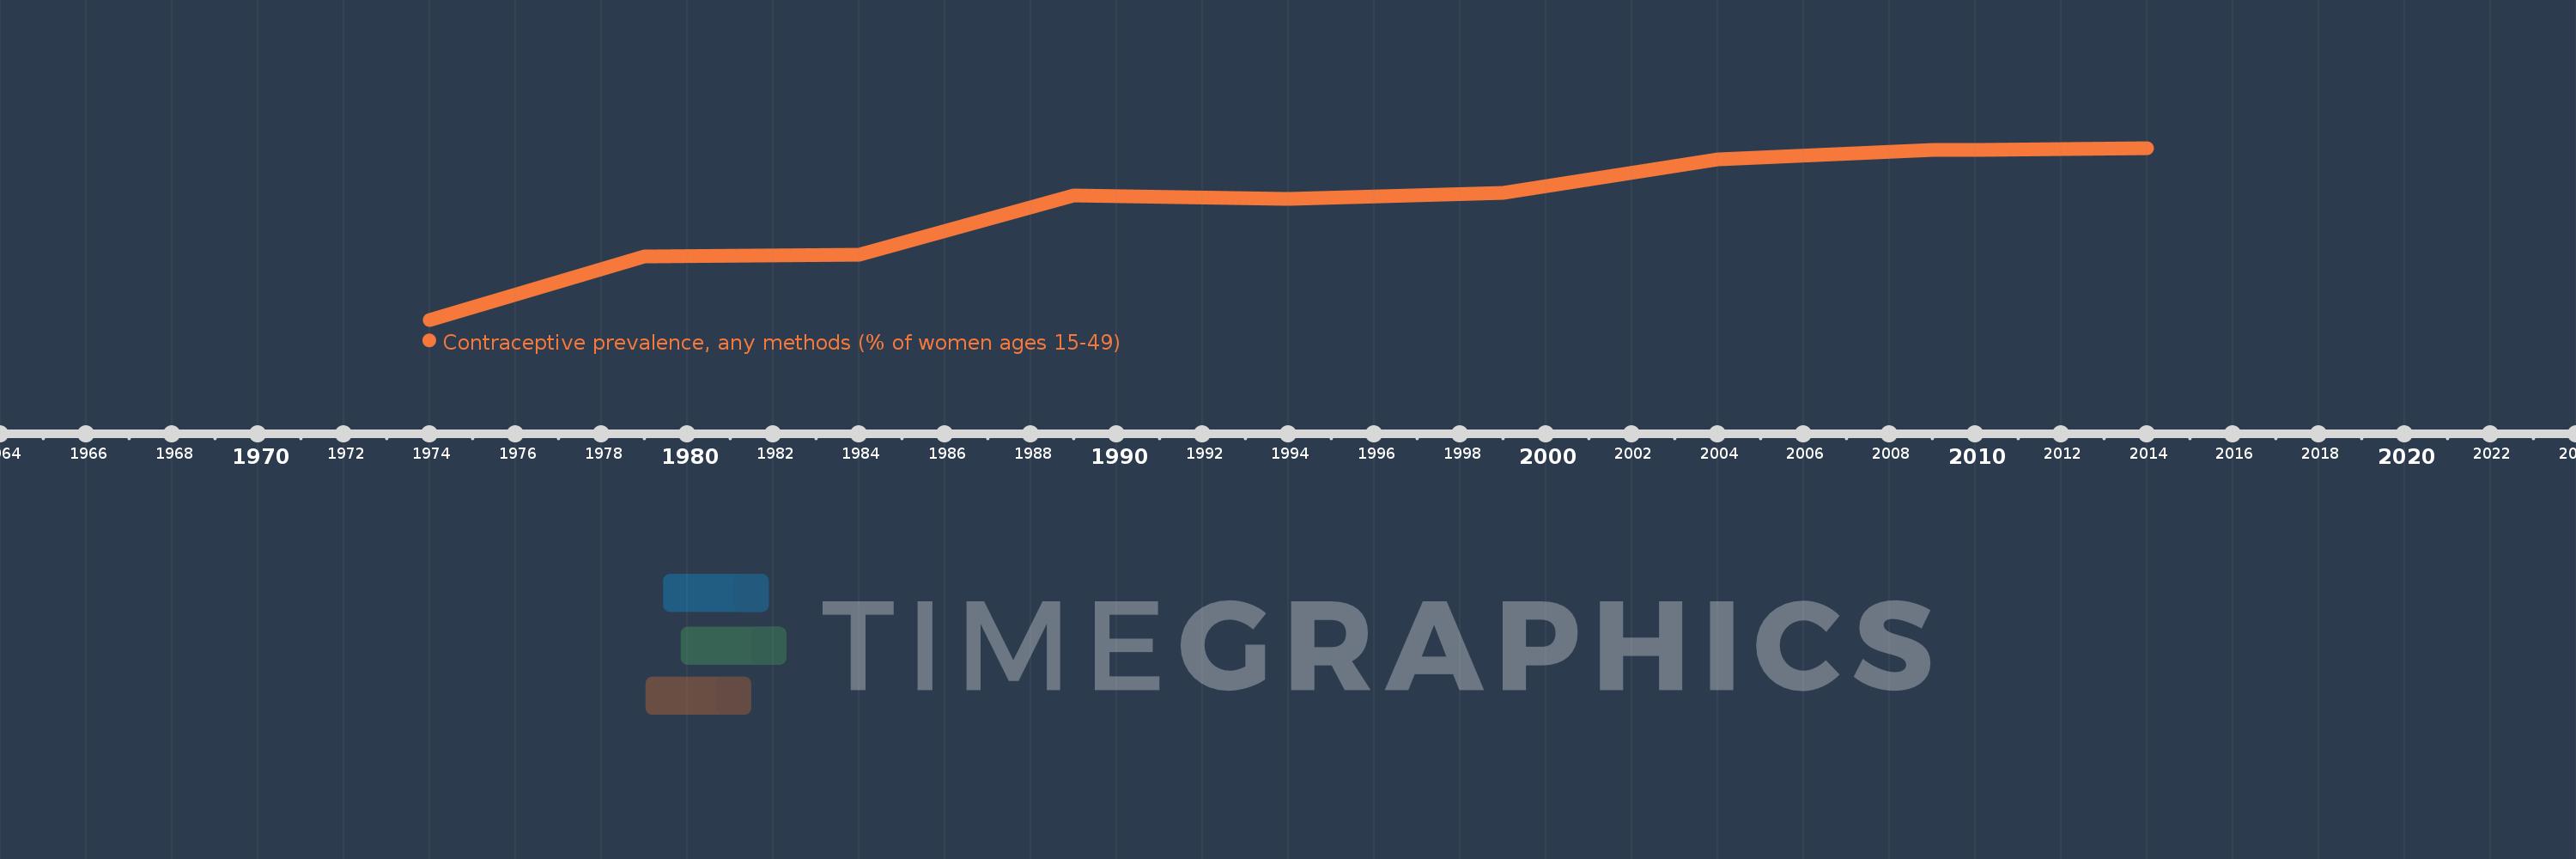
Questa scala temporale mostra un grafico dal 1974 anno al 2014 anno. Turkey. I dati fino ad 1973 anno non disponibili. Il numero di osservazioni attuali secondo i date: 10.
La fonte (nome):
Indicatori dello sviluppo mondiale
La fonte (organizzazione):
UNICEF's State of the World's Children and Childinfo, United Nations Population Division's World Contraceptive Use, household surveys including Demographic and Health Surveys and Multiple Indicator Cluster Surveys.
Categorie:
Health, Gender
sono stati aggiornati
23 apr 2017 anni
Indicatori delle variazioni dei valori per anni
In media:
61.82
Minima:
36.8
1 gen 1974 anni
Massimo:
73.5
1 gen 2014 anni
Alla data di osservazione
Valore
Variazione assoluta
La variazione rispetto al valore precedente
1 gen 1974 anni
36.8
+36.8
0.0%
1 gen 1979 anni
50.4
+13.6
36.96%
1 gen 1984 anni
50.6
+0.2
0.4%
1 gen 1989 anni
63.4
+12.8
25.3%
1 gen 1994 anni
62.6
-0.8
-1.26%
1 gen 1999 anni
63.9
+1.3
2.08%
1 gen 2004 anni
71.0
+7.1
11.11%
1 gen 2009 anni
73.0
+2.0
2.82%
1 gen 2010 anni
73.0
0.0
0.0%
1 gen 2014 anni
73.5
+0.5
0.68%
Classificazione dei paesi secondo i statistiche attuali per anni