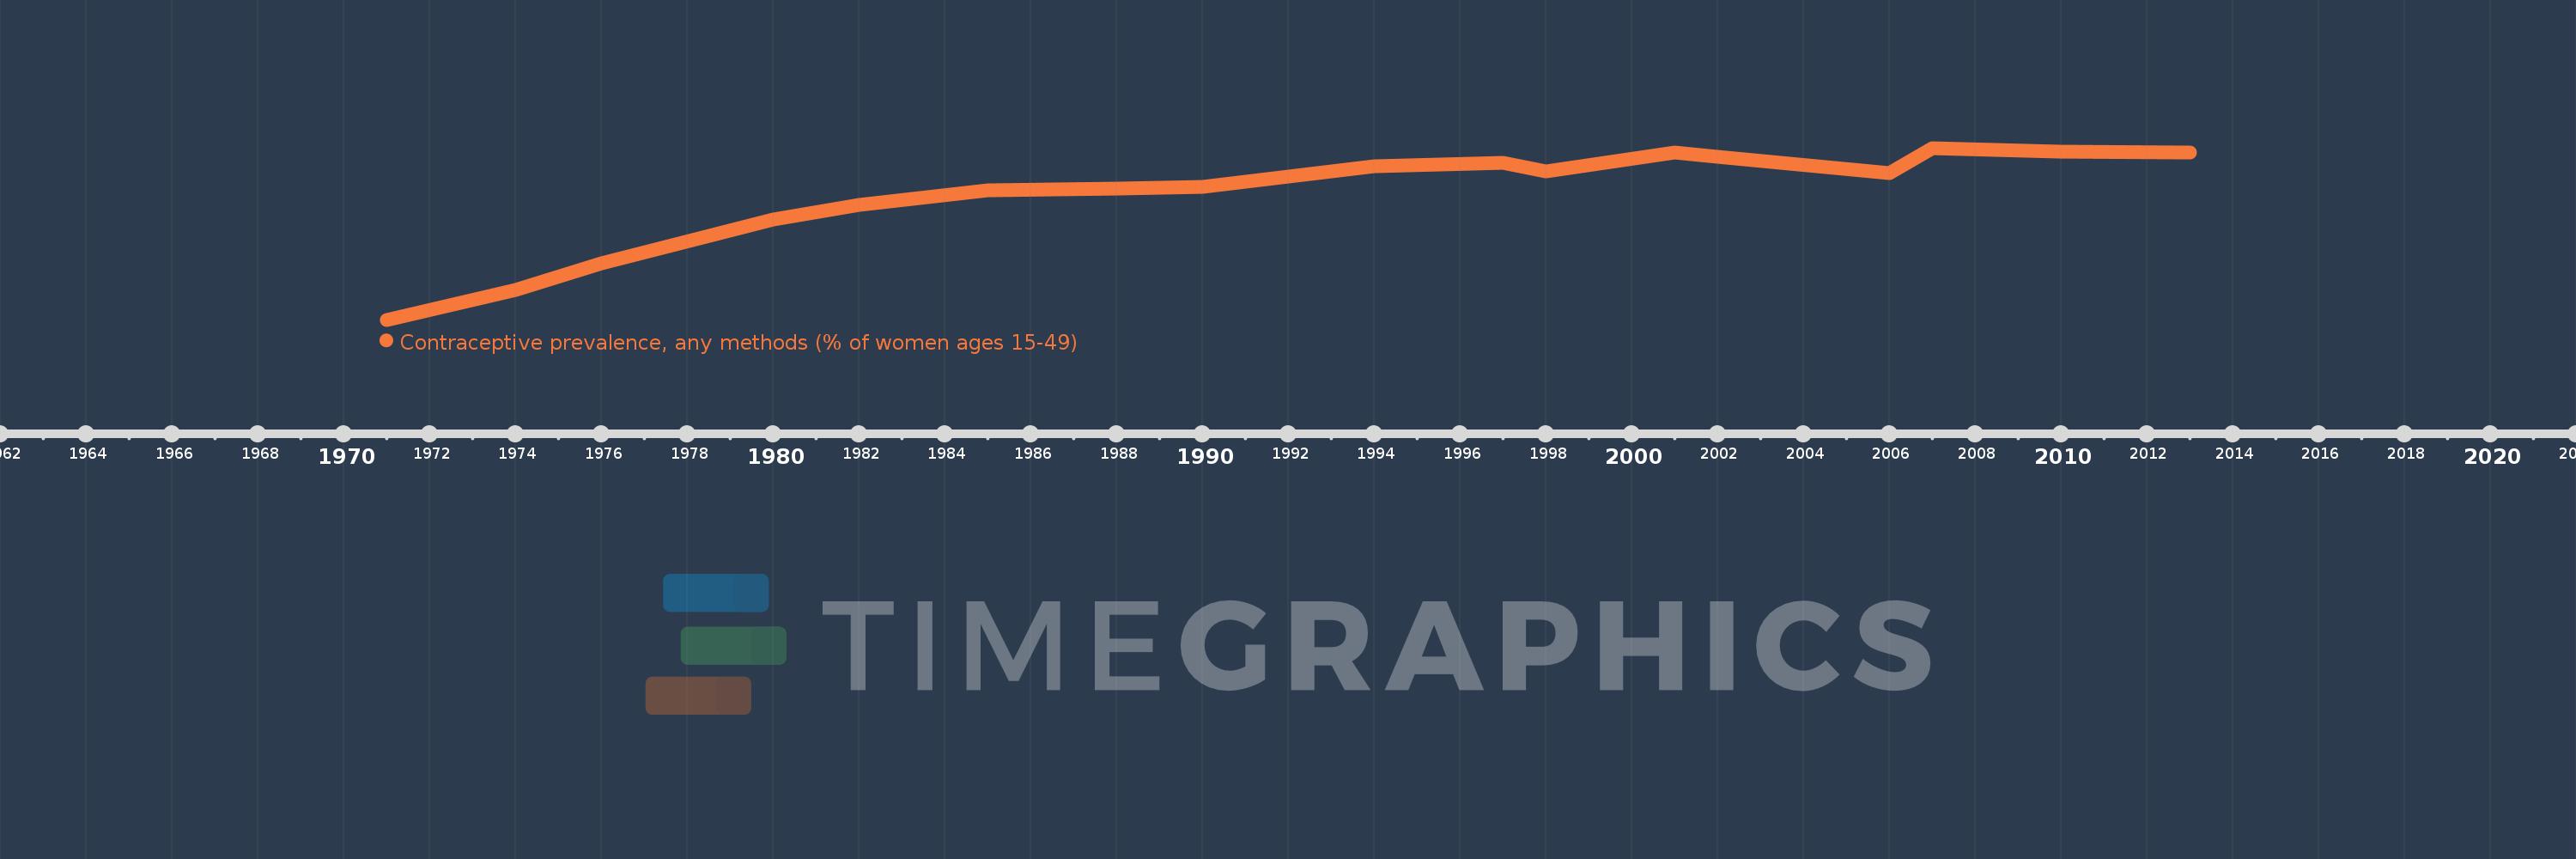
Questa scala temporale mostra un grafico dal 1971 anno al 2013 anno. Thailand. I dati fino ad 1970 anno non disponibili. Il numero di osservazioni attuali secondo i date: 17.
La fonte (nome):
Indicatori dello sviluppo mondiale
La fonte (organizzazione):
UNICEF's State of the World's Children and Childinfo, United Nations Population Division's World Contraceptive Use, household surveys including Demographic and Health Surveys and Multiple Indicator Cluster Surveys.
Categorie:
Health, Gender
sono stati aggiornati
23 apr 2017 anni
Indicatori delle variazioni dei valori per anni
In media:
63.312
Minima:
14.8
1 gen 1971 anni
Massimo:
81.1
1 gen 2007 anni
Alla data di osservazione
Valore
Variazione assoluta
La variazione rispetto al valore precedente
1 gen 1971 anni
14.8
+14.8
0.0%
1 gen 1974 anni
26.3
+11.5
77.7%
1 gen 1976 anni
36.7
+10.4
39.54%
1 gen 1980 anni
53.4
+16.7
45.5%
1 gen 1982 anni
59.0
+5.6
10.49%
1 gen 1985 anni
64.6
+5.6
9.49%
1 gen 1988 anni
65.5
+0.9
1.39%
1 gen 1990 anni
66.2
+0.7
1.07%
1 gen 1994 anni
73.9
+7.7
11.63%
1 gen 1997 anni
75.2
+1.3
1.76%
1 gen 1998 anni
72.2
-3.0
-3.99%
1 gen 2001 anni
79.2
+7.0
9.7%
1 gen 2002 anni
77.8
-1.4
-1.77%
1 gen 2006 anni
71.5
-6.3
-8.1%
1 gen 2007 anni
81.1
+9.6
13.43%
1 gen 2010 anni
79.6
-1.5
-1.85%
1 gen 2013 anni
79.3
-0.3
-0.38%
Classificazione dei paesi secondo i statistiche attuali per anni