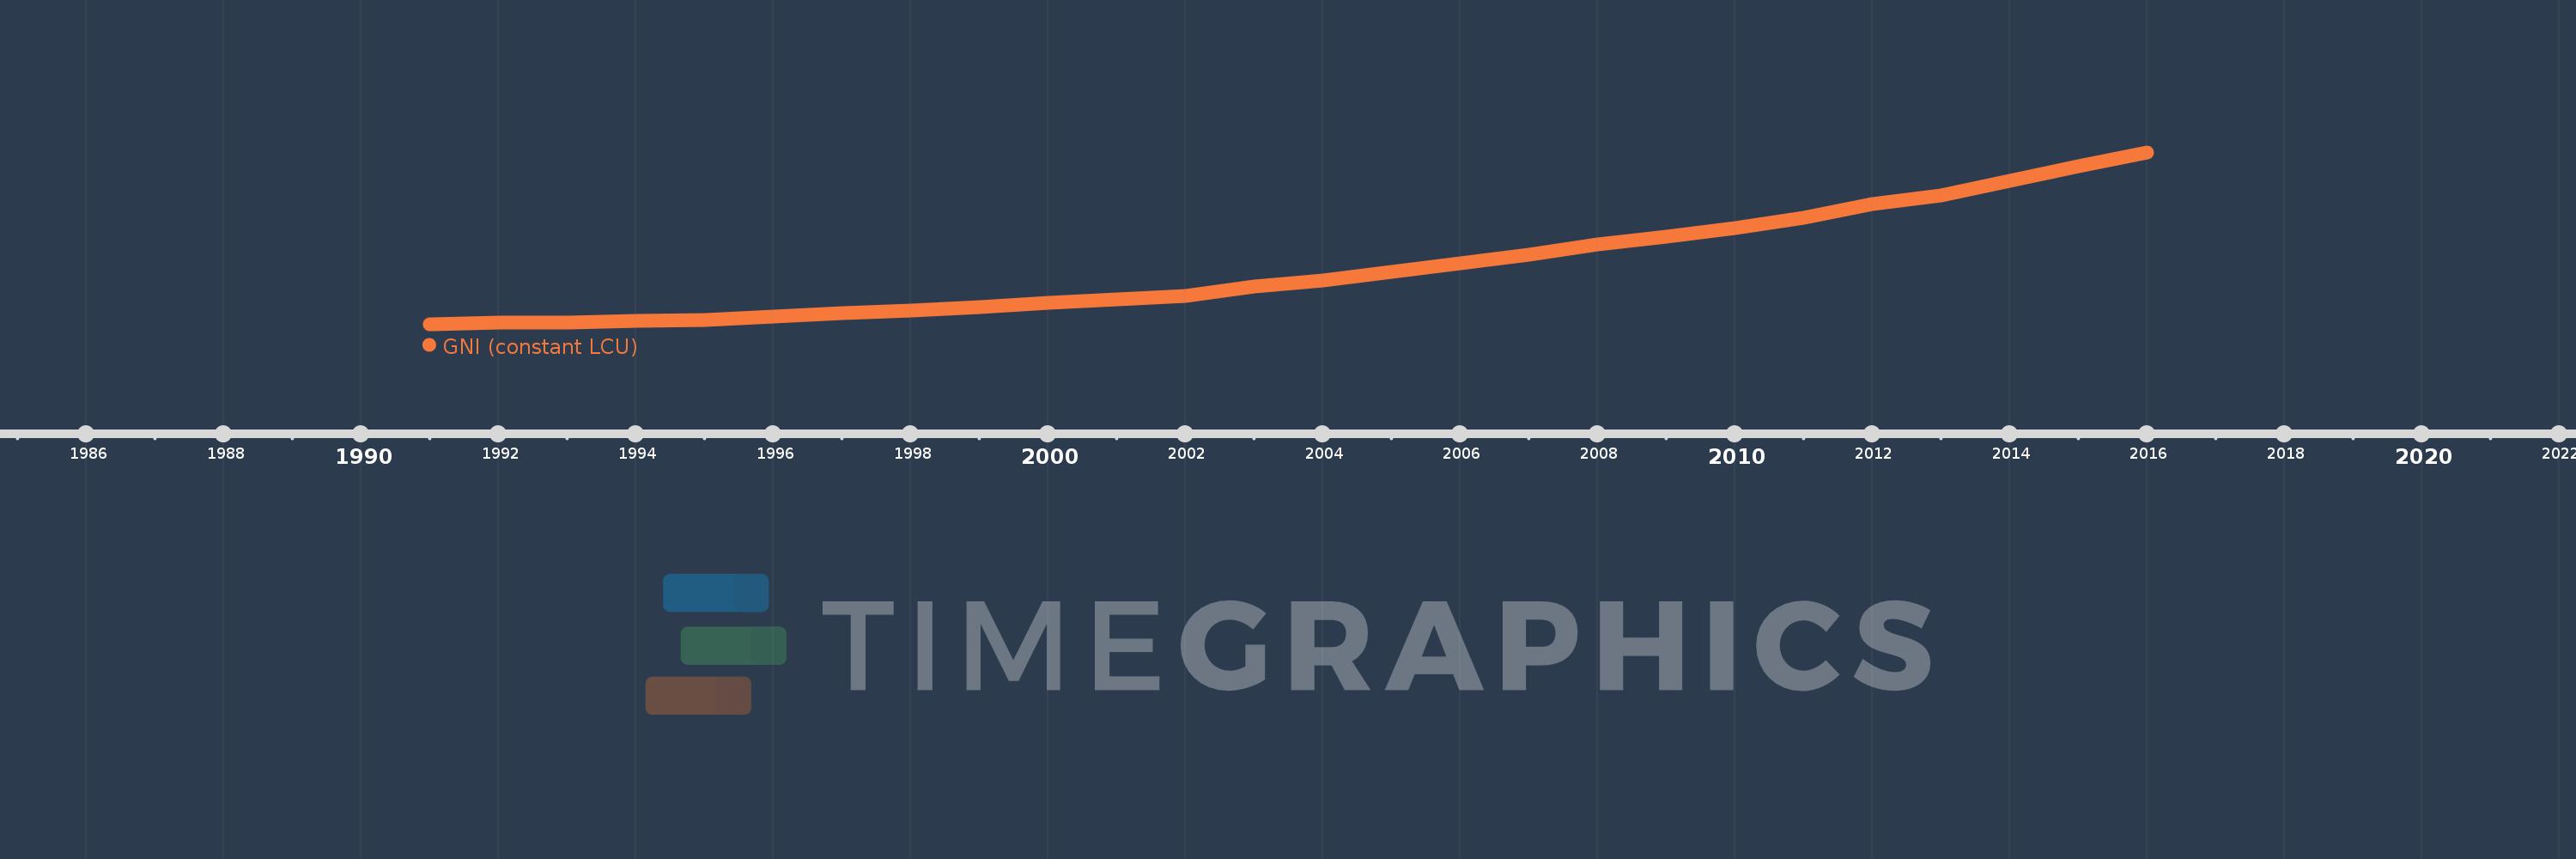
Questa scala temporale mostra un grafico dal 1991 anno al 2016 anno. Tanzania. I dati fino ad 1990 anno non disponibili. Il numero di osservazioni attuali secondo i date: 26.
La fonte (nome):
Indicatori dello sviluppo mondiale
La fonte (organizzazione):
World Bank national accounts data, and OECD National Accounts data files.
Categorie:
Economy & Growth
sono stati aggiornati
23 apr 2017 anni
Indicatori delle variazioni dei valori per anni
In media:
22.372 Trln
Minima:
11.866 Trln
1 gen 1991 anni
Massimo:
43.36 Trln
1 gen 2016 anni
Alla data di osservazione
Valore
Variazione assoluta
La variazione rispetto al valore precedente
1 gen 1991 anni
11.866 Trln
+11.866 Trln
0.0%
1 gen 1992 anni
12.174 Trln
+307.823 Mlrd
2.59%
1 gen 1993 anni
12.225 Trln
+50.327 Mlrd
0.41%
1 gen 1994 anni
12.406 Trln
+181.445 Mlrd
1.48%
1 gen 1995 anni
12.636 Trln
+229.735 Mlrd
1.85%
1 gen 1996 anni
13.192 Trln
+556.047 Mlrd
4.4%
1 gen 1997 anni
13.956 Trln
+764.689 Mlrd
5.8%
1 gen 1998 anni
14.377 Trln
+420.454 Mlrd
3.01%
1 gen 1999 anni
14.974 Trln
+596.913 Mlrd
4.15%
1 gen 2000 anni
15.719 Trln
+744.779 Mlrd
4.97%
1 gen 2001 anni
16.444 Trln
+725.604 Mlrd
4.62%
1 gen 2002 anni
17.111 Trln
+666.971 Mlrd
4.06%
1 gen 2003 anni
18.743 Trln
+1.631 Trln
9.53%
1 gen 2004 anni
19.88 Trln
+1.138 Trln
6.07%
1 gen 2005 anni
21.417 Trln
+1.536 Trln
7.73%
1 gen 2006 anni
23.095 Trln
+1.678 Trln
7.84%
1 gen 2007 anni
24.651 Trln
+1.556 Trln
6.74%
1 gen 2008 anni
26.419 Trln
+1.768 Trln
7.17%
1 gen 2009 anni
27.938 Trln
+1.519 Trln
5.75%
1 gen 2010 anni
29.469 Trln
+1.531 Trln
5.48%
1 gen 2011 anni
31.339 Trln
+1.869 Trln
6.34%
1 gen 2012 anni
33.915 Trln
+2.576 Trln
8.22%
1 gen 2013 anni
35.402 Trln
+1.487 Trln
4.39%
1 gen 2014 anni
38.185 Trln
+2.782 Trln
7.86%
1 gen 2015 anni
40.783 Trln
+2.598 Trln
6.8%
1 gen 2016 anni
43.36 Trln
+2.577 Trln
6.32%
Classificazione dei paesi secondo i statistiche attuali per anni