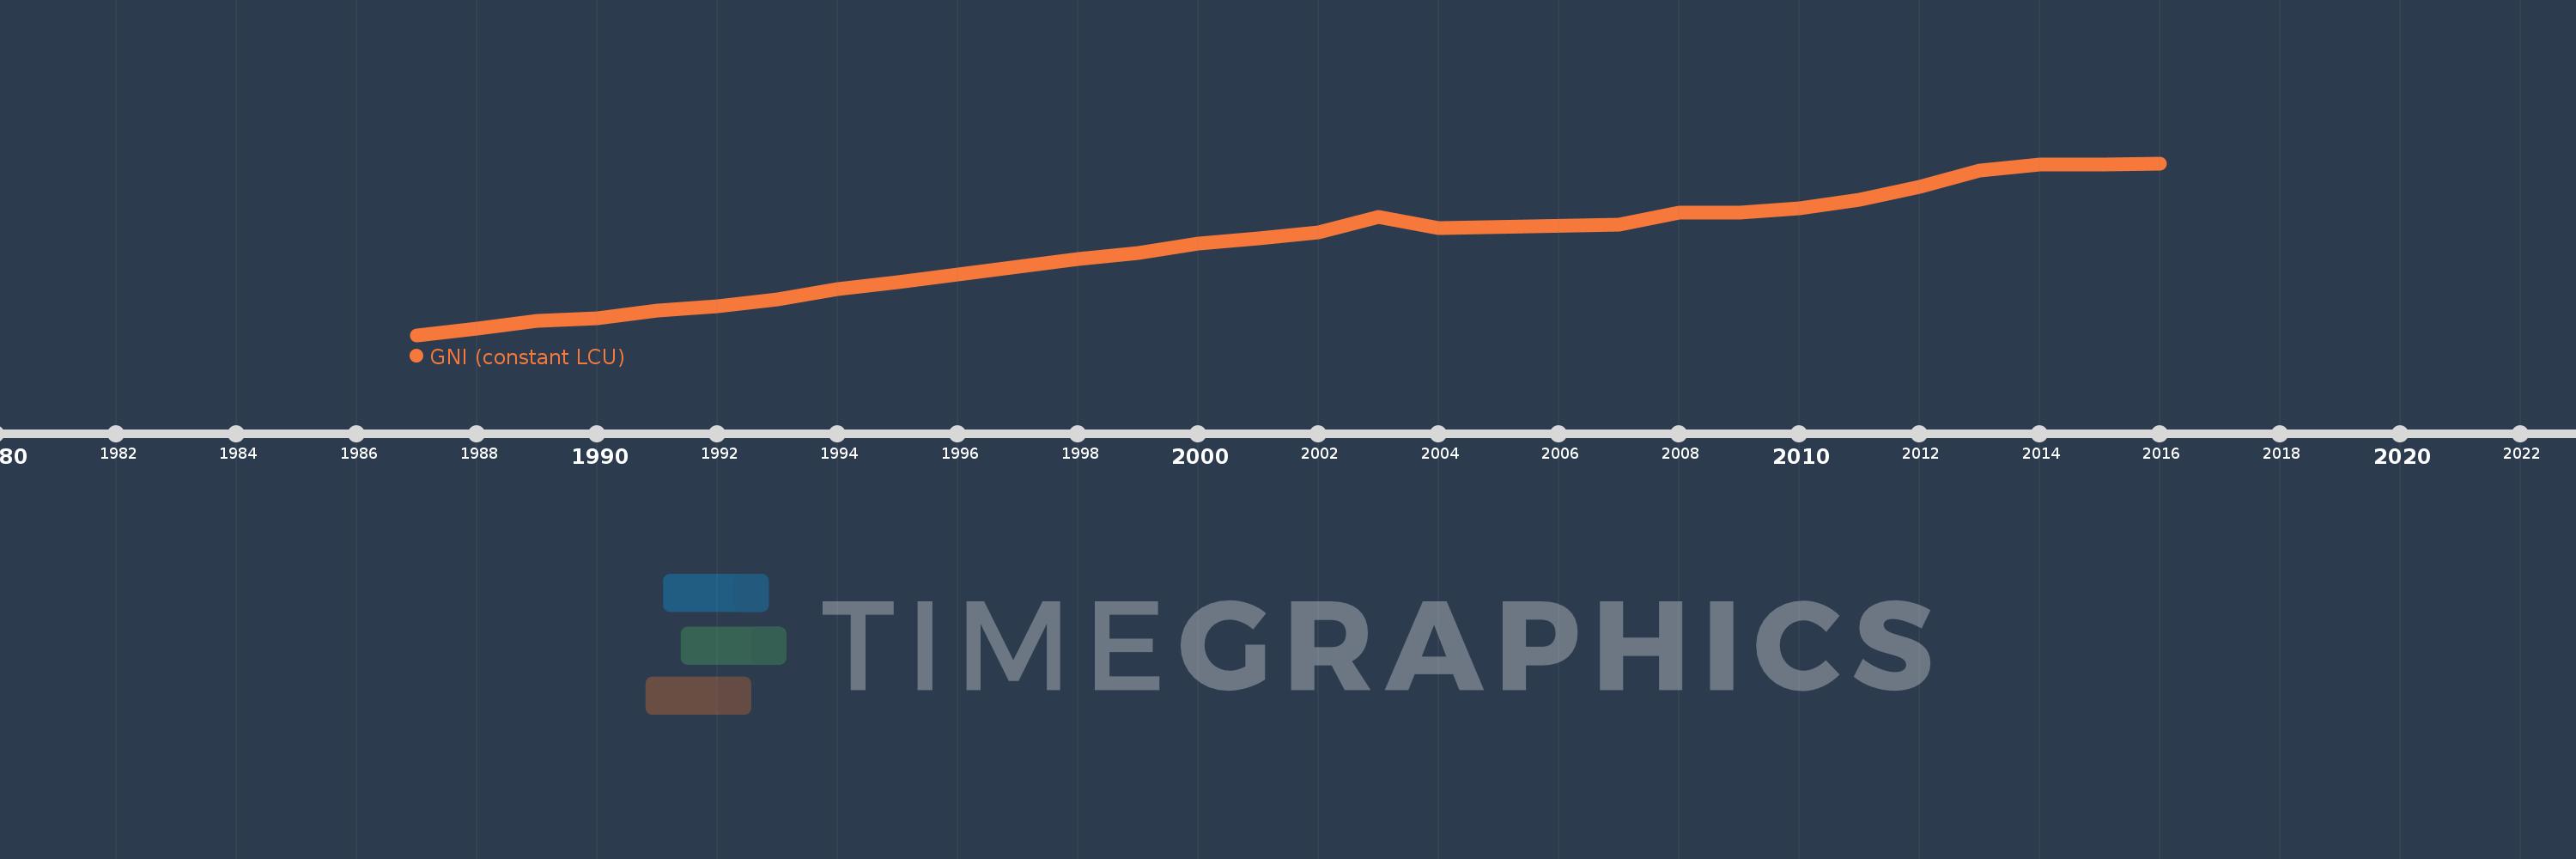
Questa scala temporale mostra un grafico dal 1987 anno al 2016 anno. Guinea. I dati fino ad 1986 anno non disponibili. Il numero di osservazioni attuali secondo i date: 28.
La fonte (nome):
Indicatori dello sviluppo mondiale
La fonte (organizzazione):
World Bank national accounts data, and OECD National Accounts data files.
Categorie:
Economy & Growth
sono stati aggiornati
23 apr 2017 anni
Indicatori delle variazioni dei valori per anni
In media:
5.812 Trln
Minima:
3.243 Trln
1 gen 1987 anni
Massimo:
8.245 Trln
1 gen 2016 anni
Alla data di osservazione
Valore
Variazione assoluta
La variazione rispetto al valore precedente
1 gen 1987 anni
3.243 Trln
+3.243 Trln
0.0%
1 gen 1988 anni
3.419 Trln
+176.07 Mlrd
5.43%
1 gen 1989 anni
3.658 Trln
+238.643 Mlrd
6.98%
1 gen 1990 anni
3.741 Trln
+83.528 Mlrd
2.28%
1 gen 1991 anni
3.964 Trln
+222.488 Mlrd
5.95%
1 gen 1992 anni
4.074 Trln
+110.266 Mlrd
2.78%
1 gen 1993 anni
4.277 Trln
+202.754 Mlrd
4.98%
1 gen 1994 anni
4.58 Trln
+303.699 Mlrd
7.1%
1 gen 1995 anni
4.784 Trln
+203.43 Mlrd
4.44%
1 gen 1996 anni
5.006 Trln
+222.453 Mlrd
4.65%
1 gen 1997 anni
5.222 Trln
+215.94 Mlrd
4.31%
1 gen 1998 anni
5.454 Trln
+232.327 Mlrd
4.45%
1 gen 1999 anni
5.627 Trln
+172.615 Mlrd
3.16%
1 gen 2000 anni
5.91 Trln
+283.32 Mlrd
5.03%
1 gen 2001 anni
6.052 Trln
+142.027 Mlrd
2.4%
1 gen 2002 anni
6.233 Trln
+180.293 Mlrd
2.98%
1 gen 2003 anni
6.683 Trln
+450.689 Mlrd
7.23%
1 gen 2004 anni
6.354 Trln
-329.608 Mlrd
-4.93%
1 gen 2007 anni
6.462 Trln
+108.134 Mlrd
1.7%
1 gen 2008 anni
6.799 Trln
+337.248 Mlrd
5.22%
1 gen 2009 anni
6.816 Trln
+17.138 Mlrd
0.25%
1 gen 2010 anni
6.933 Trln
+116.731 Mlrd
1.71%
1 gen 2011 anni
7.187 Trln
+253.892 Mlrd
3.66%
1 gen 2012 anni
7.556 Trln
+368.832 Mlrd
5.13%
1 gen 2013 anni
8.032 Trln
+476.165 Mlrd
6.3%
1 gen 2014 anni
8.206 Trln
+173.711 Mlrd
2.16%
1 gen 2015 anni
8.214 Trln
+8.083 Mlrd
0.1%
1 gen 2016 anni
8.245 Trln
+31.517 Mlrd
0.38%
Classificazione dei paesi secondo i statistiche attuali per anni