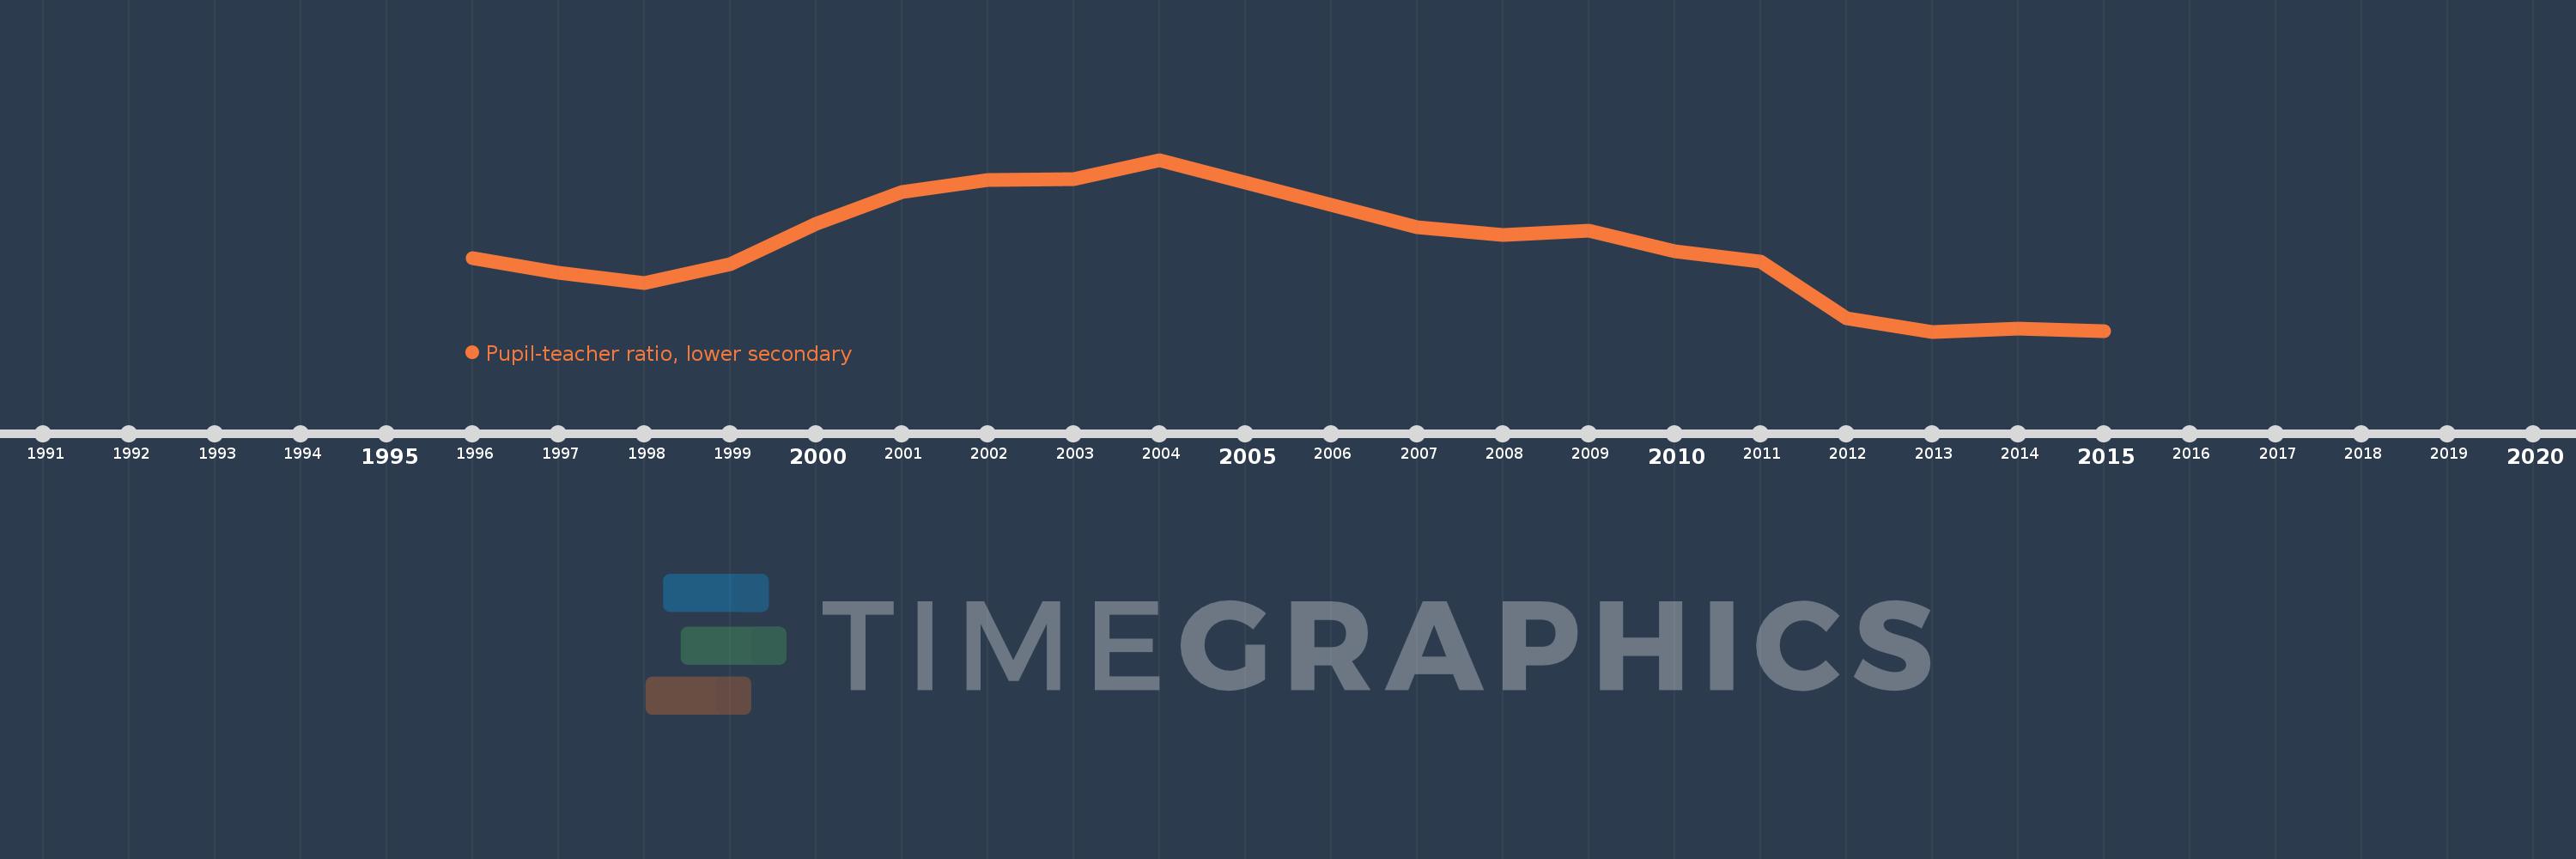
Questa scala temporale mostra un grafico dal 1996 anno al 2015 anno. Central Europe and the Baltics. I dati fino ad 1995 anno non disponibili. Il numero di osservazioni attuali secondo i date: 20.
La fonte (nome):
Indicatori dello sviluppo mondiale
La fonte (organizzazione):
United Nations Educational, Scientific, and Cultural Organization (UNESCO) Institute for Statistics.
Categorie:
Education
sono stati aggiornati
23 apr 2017 anni
Indicatori delle variazioni dei valori per anni
In media:
11.015
Minima:
9.796
1 gen 2013 anni
Massimo:
12.238
1 gen 2004 anni
Alla data di osservazione
Valore
Variazione assoluta
La variazione rispetto al valore precedente
1 gen 1996 anni
10.838
+10.838
0.0%
1 gen 1997 anni
10.628
-0.21
-1.94%
1 gen 1998 anni
10.48
-0.148
-1.39%
1 gen 1999 anni
10.757
+0.277
2.64%
1 gen 2000 anni
11.323
+0.566
5.26%
1 gen 2001 anni
11.778
+0.455
4.02%
1 gen 2002 anni
11.947
+0.17
1.44%
1 gen 2003 anni
11.964
+0.017
0.14%
1 gen 2004 anni
12.238
+0.274
2.29%
1 gen 2005 anni
11.92
-0.319
-2.6%
1 gen 2006 anni
11.592
-0.328
-2.75%
1 gen 2007 anni
11.281
-0.311
-2.69%
1 gen 2008 anni
11.165
-0.115
-1.02%
1 gen 2009 anni
11.226
+0.061
0.54%
1 gen 2010 anni
10.941
-0.285
-2.54%
1 gen 2011 anni
10.792
-0.149
-1.36%
1 gen 2012 anni
9.987
-0.805
-7.46%
1 gen 2013 anni
9.796
-0.191
-1.91%
1 gen 2014 anni
9.834
+0.038
0.39%
1 gen 2015 anni
9.807
-0.028
-0.28%
Classificazione dei paesi secondo i statistiche attuali per anni