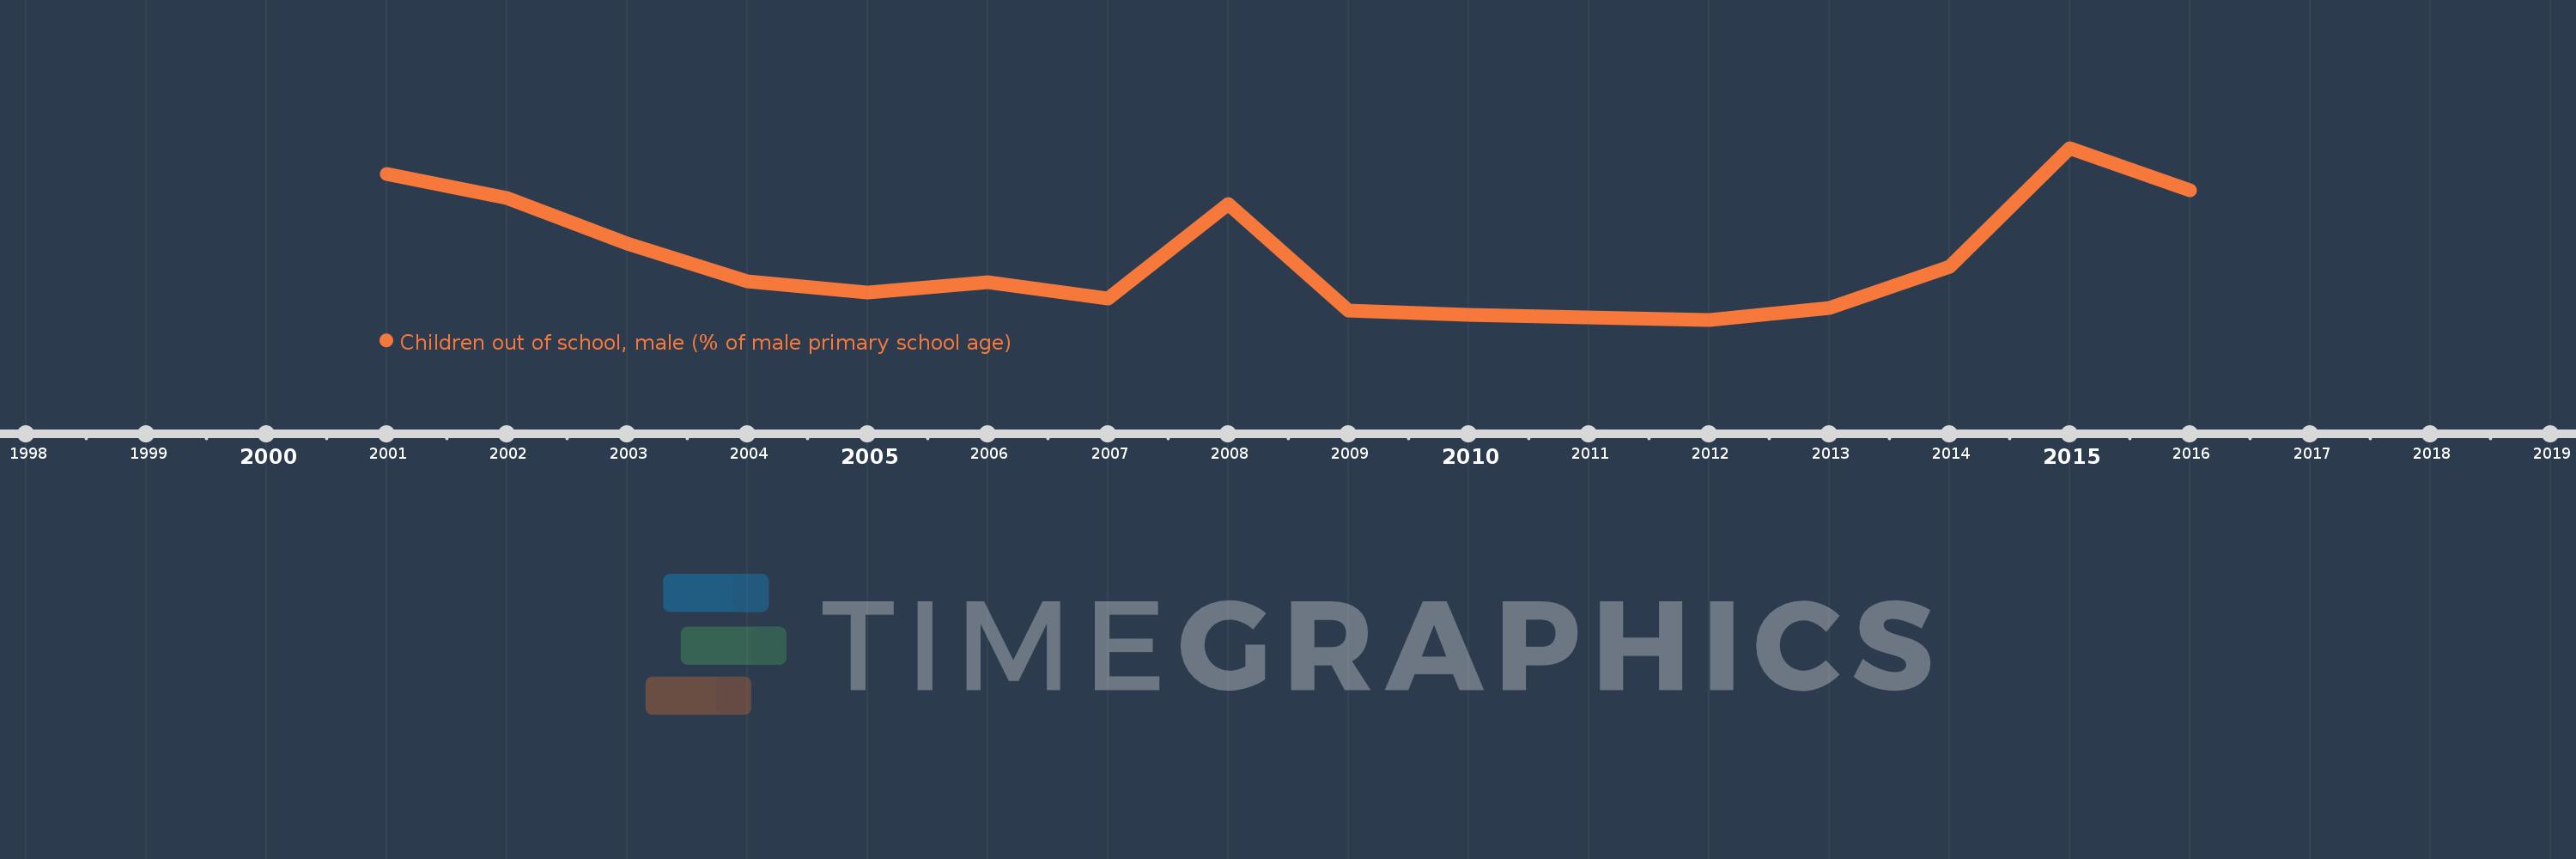
Questa scala temporale mostra un grafico dal 2001 anno al 2016 anno. Tajikistan. I dati fino ad 2000 anno non disponibili. Il numero di osservazioni attuali secondo i date: 16.
La fonte (nome):
Indicatori dello sviluppo mondiale
La fonte (organizzazione):
United Nations Educational, Scientific, and Cultural Organization (UNESCO) Institute for Statistics.
Categorie:
Education
sono stati aggiornati
23 apr 2017 anni
Indicatori delle variazioni dei valori per anni
In media:
1.234
Minima:
0.487
1 gen 2012 anni
Massimo:
2.612
1 gen 2015 anni
Alla data di osservazione
Valore
Variazione assoluta
La variazione rispetto al valore precedente
1 gen 2001 anni
2.294
+2.294
0.0%
1 gen 2002 anni
1.995
-0.299
-13.04%
1 gen 2003 anni
1.426
-0.569
-28.53%
1 gen 2004 anni
0.957
-0.469
-32.86%
1 gen 2005 anni
0.829
-0.129
-13.43%
1 gen 2006 anni
0.95
+0.121
14.61%
1 gen 2007 anni
0.752
-0.198
-20.83%
1 gen 2008 anni
1.918
+1.166
155.14%
1 gen 2009 anni
0.599
-1.319
-68.78%
1 gen 2010 anni
0.552
-0.047
-7.86%
1 gen 2011 anni
0.515
-0.037
-6.7%
1 gen 2012 anni
0.487
-0.028
-5.49%
1 gen 2013 anni
0.628
+0.141
29.05%
1 gen 2014 anni
1.144
+0.516
82.16%
1 gen 2015 anni
2.612
+1.468
128.31%
1 gen 2016 anni
2.088
-0.523
-20.04%
Classificazione dei paesi secondo i statistiche attuali per anni