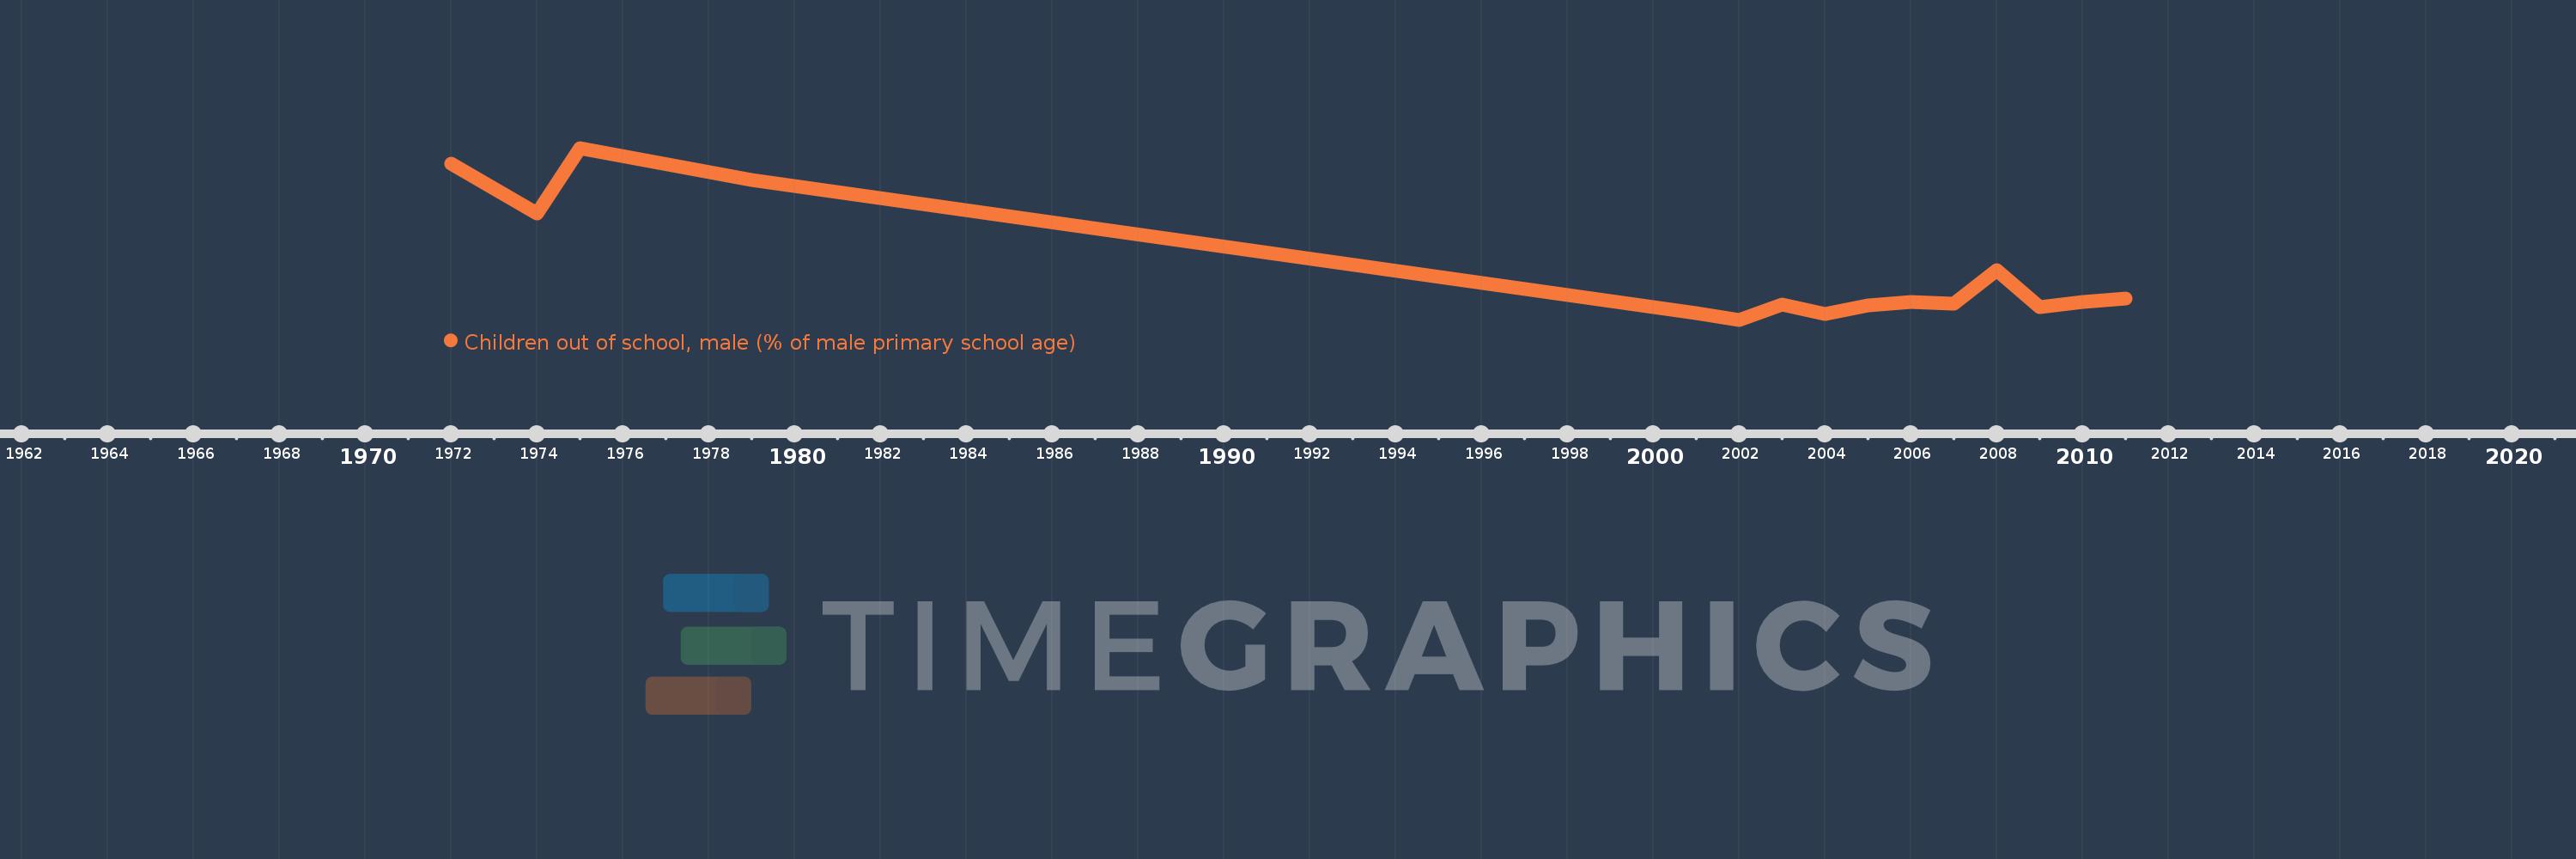
Questa scala temporale mostra un grafico dal 1972 anno al 2011 anno. Myanmar. I dati fino ad 1971 anno non disponibili. Il numero di osservazioni attuali secondo i date: 15.
La fonte (nome):
Indicatori dello sviluppo mondiale
La fonte (organizzazione):
United Nations Educational, Scientific, and Cultural Organization (UNESCO) Institute for Statistics.
Categorie:
Education
sono stati aggiornati
23 apr 2017 anni
Indicatori delle variazioni dei valori per anni
In media:
16.751
Minima:
8.003
1 gen 2002 anni
Massimo:
38.055
1 gen 1975 anni
Alla data di osservazione
Valore
Variazione assoluta
La variazione rispetto al valore precedente
1 gen 1972 anni
35.261
+35.261
0.0%
1 gen 1974 anni
26.544
-8.717
-24.72%
1 gen 1975 anni
38.055
+11.511
43.36%
1 gen 1979 anni
32.436
-5.619
-14.77%
1 gen 2001 anni
9.095
-23.341
-71.96%
1 gen 2002 anni
8.003
-1.092
-12.0%
1 gen 2003 anni
10.708
+2.704
33.79%
1 gen 2004 anni
8.978
-1.73
-16.16%
1 gen 2005 anni
10.444
+1.467
16.34%
1 gen 2006 anni
11.061
+0.617
5.91%
1 gen 2007 anni
10.815
-0.246
-2.23%
1 gen 2008 anni
16.68
+5.865
54.23%
1 gen 2009 anni
10.285
-6.395
-38.34%
1 gen 2010 anni
11.132
+0.847
8.23%
1 gen 2011 anni
11.761
+0.63
5.66%
Classificazione dei paesi secondo i statistiche attuali per anni