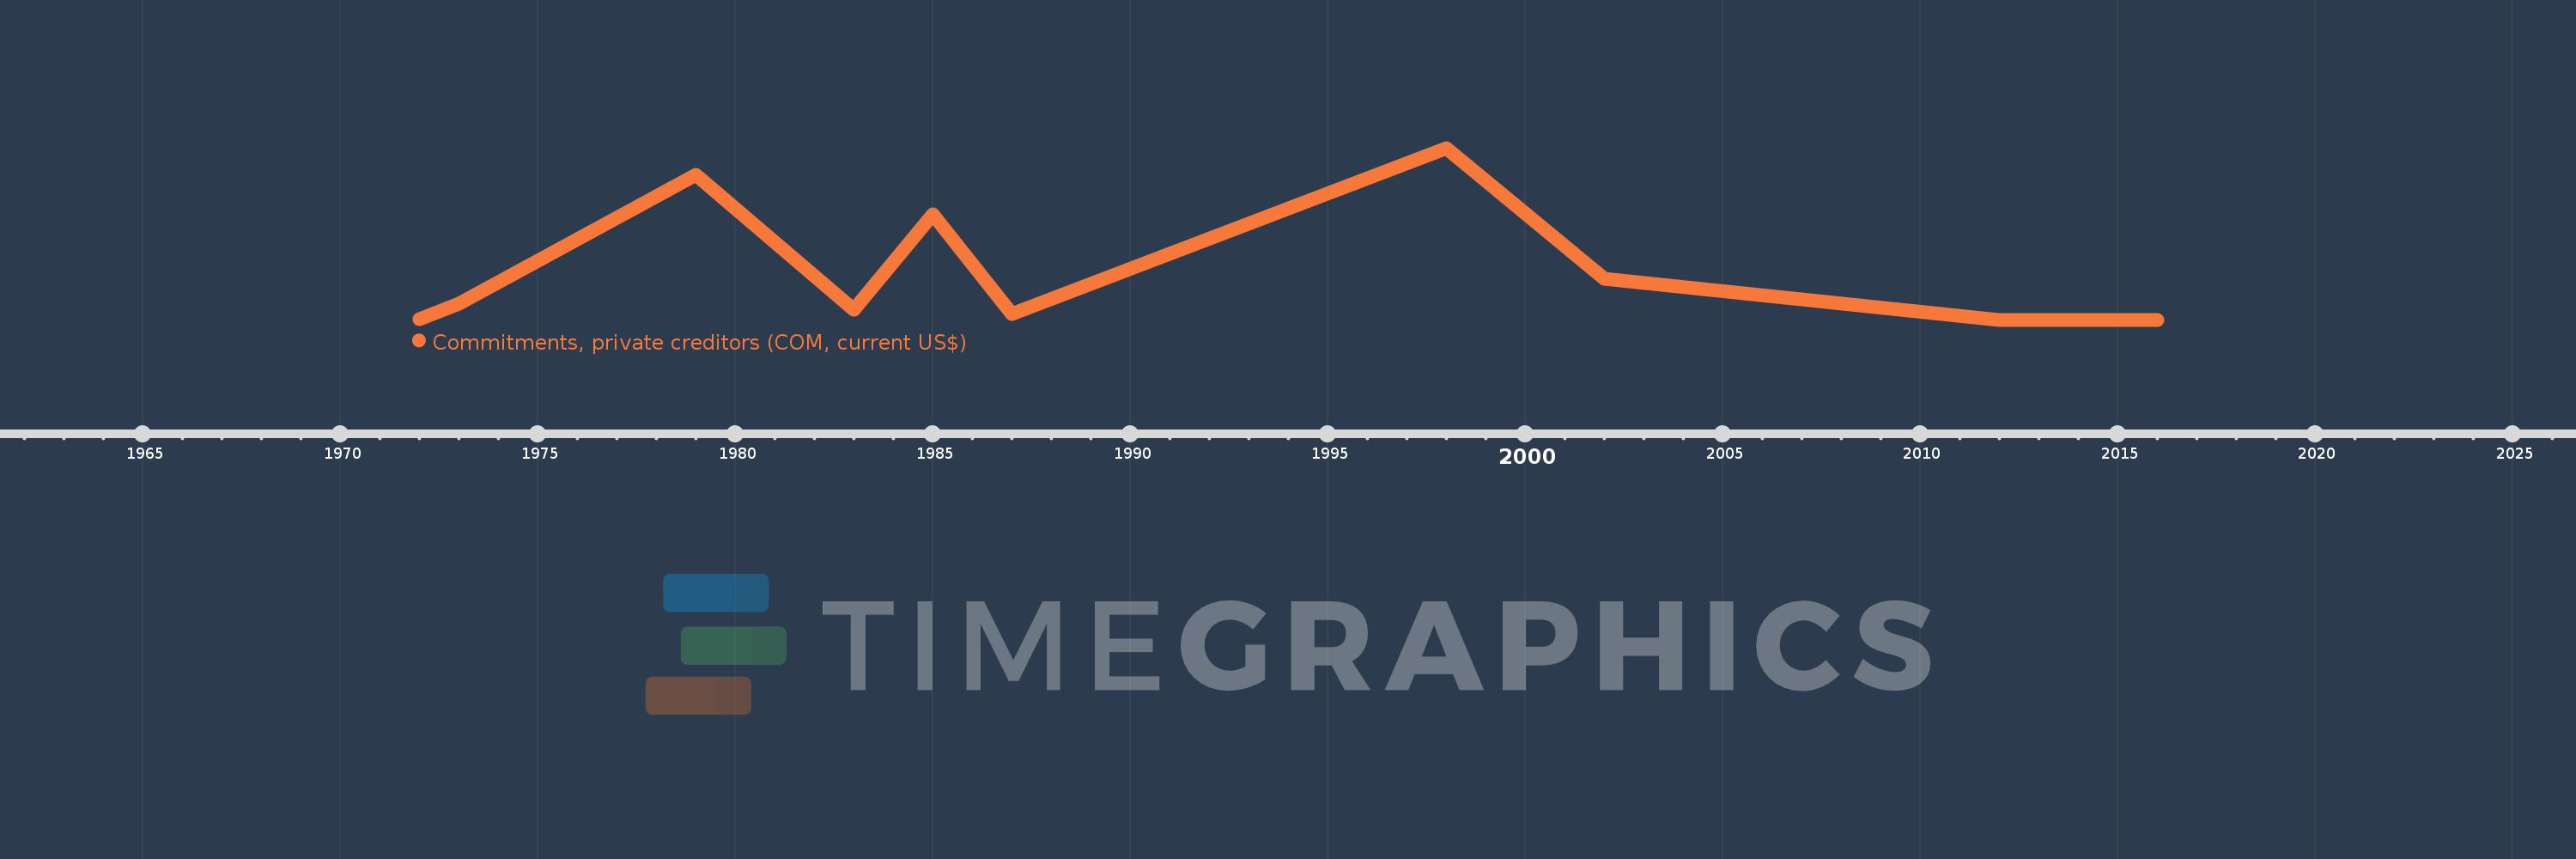
Questa scala temporale mostra un grafico dal 1972 anno al 2016 anno. Swaziland. I dati fino ad 1971 anno non disponibili. Il numero di osservazioni attuali secondo i date: 13.
La fonte (nome):
Indicatori dello sviluppo mondiale
La fonte (organizzazione):
World Bank, International Debt Statistics.
Categorie:
External Debt
sono stati aggiornati
23 apr 2017 anni
Indicatori delle variazioni dei valori per anni
In media:
7.236 Mln
Minima:
0.0
1 gen 2012 anni
Massimo:
32.586 Mln
1 gen 1998 anni
Alla data di osservazione
Valore
Variazione assoluta
La variazione rispetto al valore precedente
1 gen 1972 anni
105.0 Mille.
+105.0 Mille.
0.0%
1 gen 1973 anni
3.118 Mln
+3.013 Mln
2.87 Mille.%
1 gen 1979 anni
27.514 Mln
+24.396 Mln
782.42%
1 gen 1983 anni
1.913 Mln
-25.601 Mln
-93.05%
1 gen 1985 anni
19.996 Mln
+18.083 Mln
945.27%
1 gen 1987 anni
1.067 Mln
-18.929 Mln
-94.66%
1 gen 1998 anni
32.586 Mln
+31.519 Mln
2.95 Mille.%
1 gen 2002 anni
7.771 Mln
-24.815 Mln
-76.15%
1 gen 2012 anni
0.0
-7.771 Mln
-100.0%
1 gen 2013 anni
0.0
0.0
%
1 gen 2014 anni
0.0
0.0
%
1 gen 2015 anni
0.0
0.0
%
1 gen 2016 anni
0.0
0.0
%
Classificazione dei paesi secondo i statistiche attuali per anni