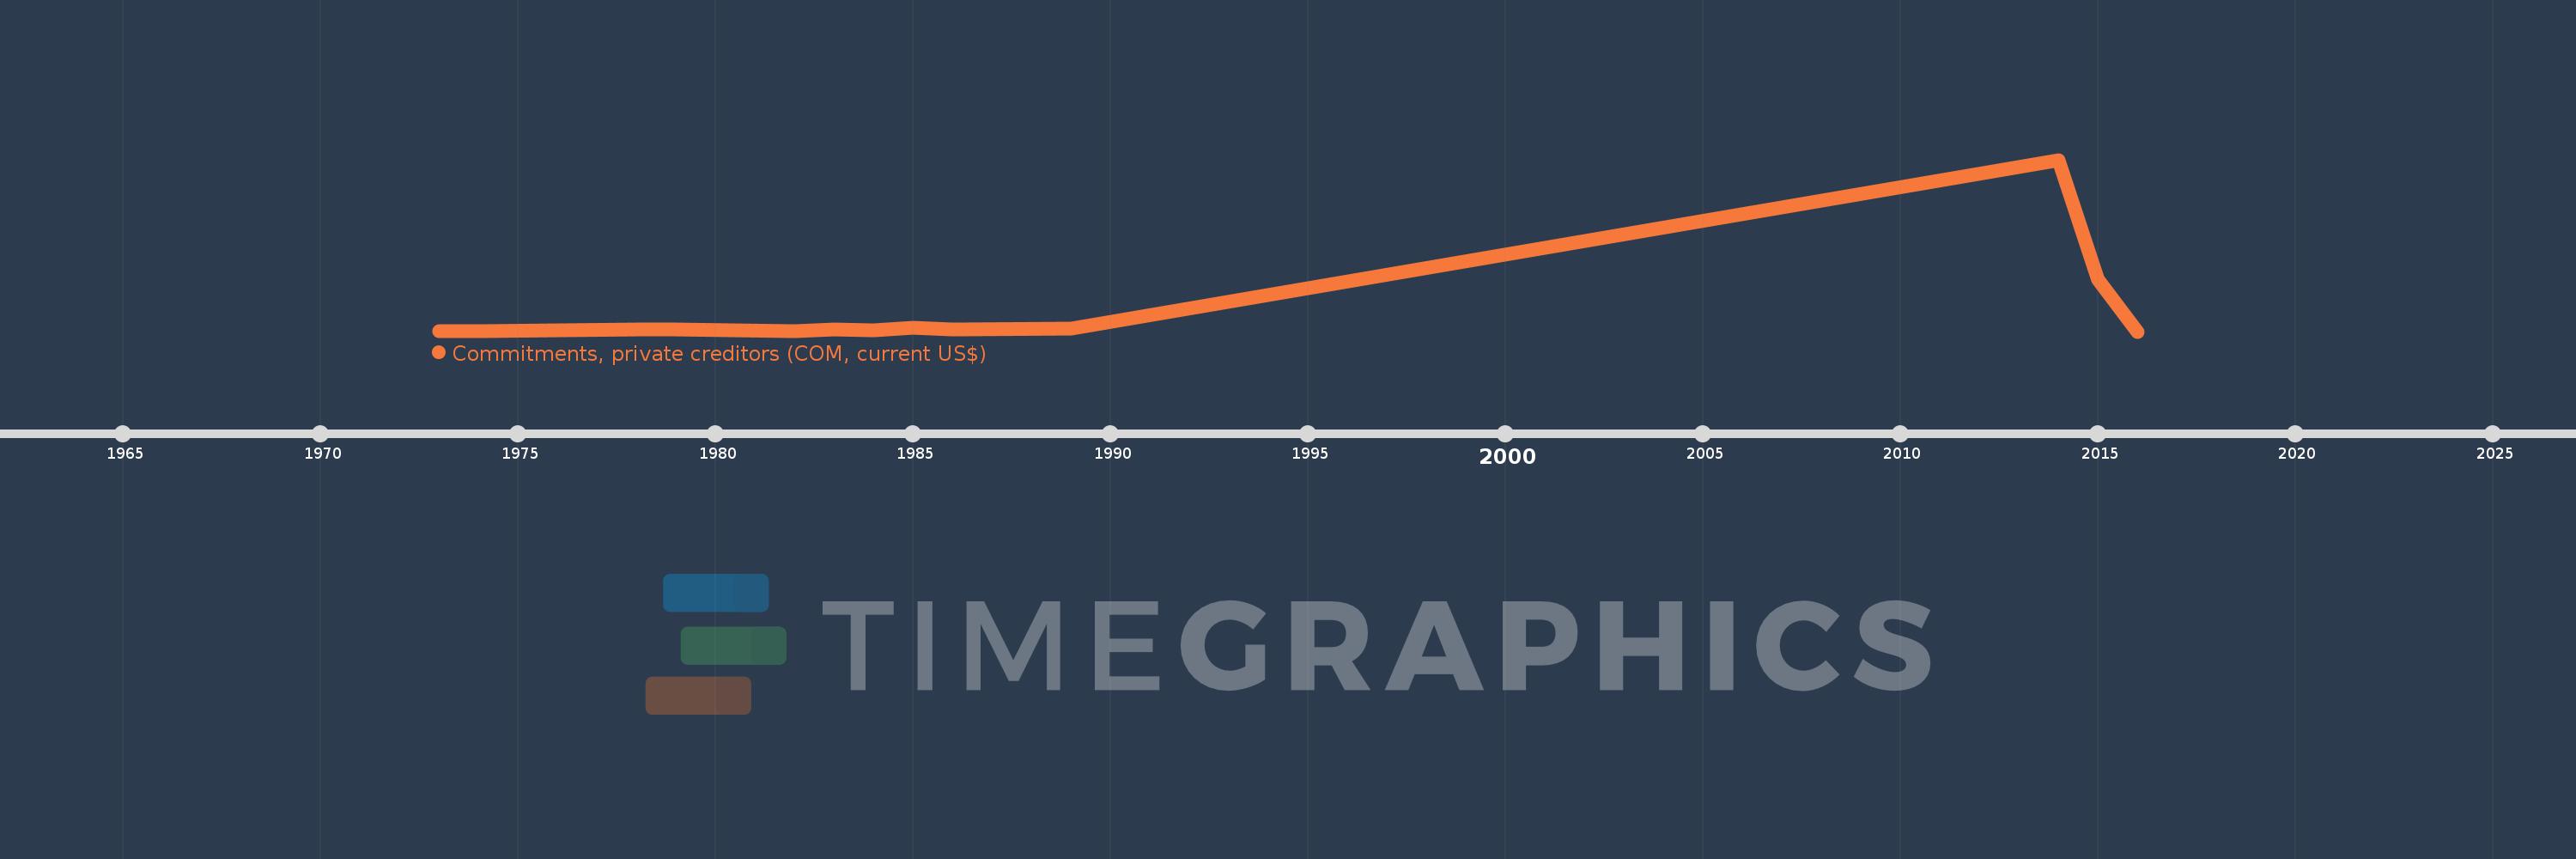
Questa scala temporale mostra un grafico dal 1973 anno al 2016 anno. Rwanda. I dati fino ad 1972 anno non disponibili. Il numero di osservazioni attuali secondo i date: 13.
La fonte (nome):
Indicatori dello sviluppo mondiale
La fonte (organizzazione):
World Bank, International Debt Statistics.
Categorie:
External Debt
sono stati aggiornati
23 apr 2017 anni
Indicatori delle variazioni dei valori per anni
In media:
43.27 Mln
Minima:
0.0
1 gen 2016 anni
Massimo:
400.0 Mln
1 gen 2014 anni
Alla data di osservazione
Valore
Variazione assoluta
La variazione rispetto al valore precedente
1 gen 1973 anni
847.0 Mille.
+847.0 Mille.
0.0%
1 gen 1974 anni
1.972 Mln
+1.125 Mln
132.82%
1 gen 1978 anni
4.335 Mln
+2.363 Mln
119.83%
1 gen 1979 anni
4.728 Mln
+393.0 Mille.
9.07%
1 gen 1982 anni
1.5 Mln
-3.228 Mln
-68.27%
1 gen 1983 anni
4.298 Mln
+2.798 Mln
186.53%
1 gen 1984 anni
2.635 Mln
-1.663 Mln
-38.69%
1 gen 1985 anni
9.072 Mln
+6.437 Mln
244.29%
1 gen 1986 anni
4.637 Mln
-4.435 Mln
-48.89%
1 gen 1989 anni
6.491 Mln
+1.854 Mln
39.98%
1 gen 2014 anni
400.0 Mln
+393.509 Mln
6.06 Mille.%
1 gen 2015 anni
122.0 Mln
-278.0 Mln
-69.5%
1 gen 2016 anni
0.0
-122.0 Mln
-100.0%
Classificazione dei paesi secondo i statistiche attuali per anni