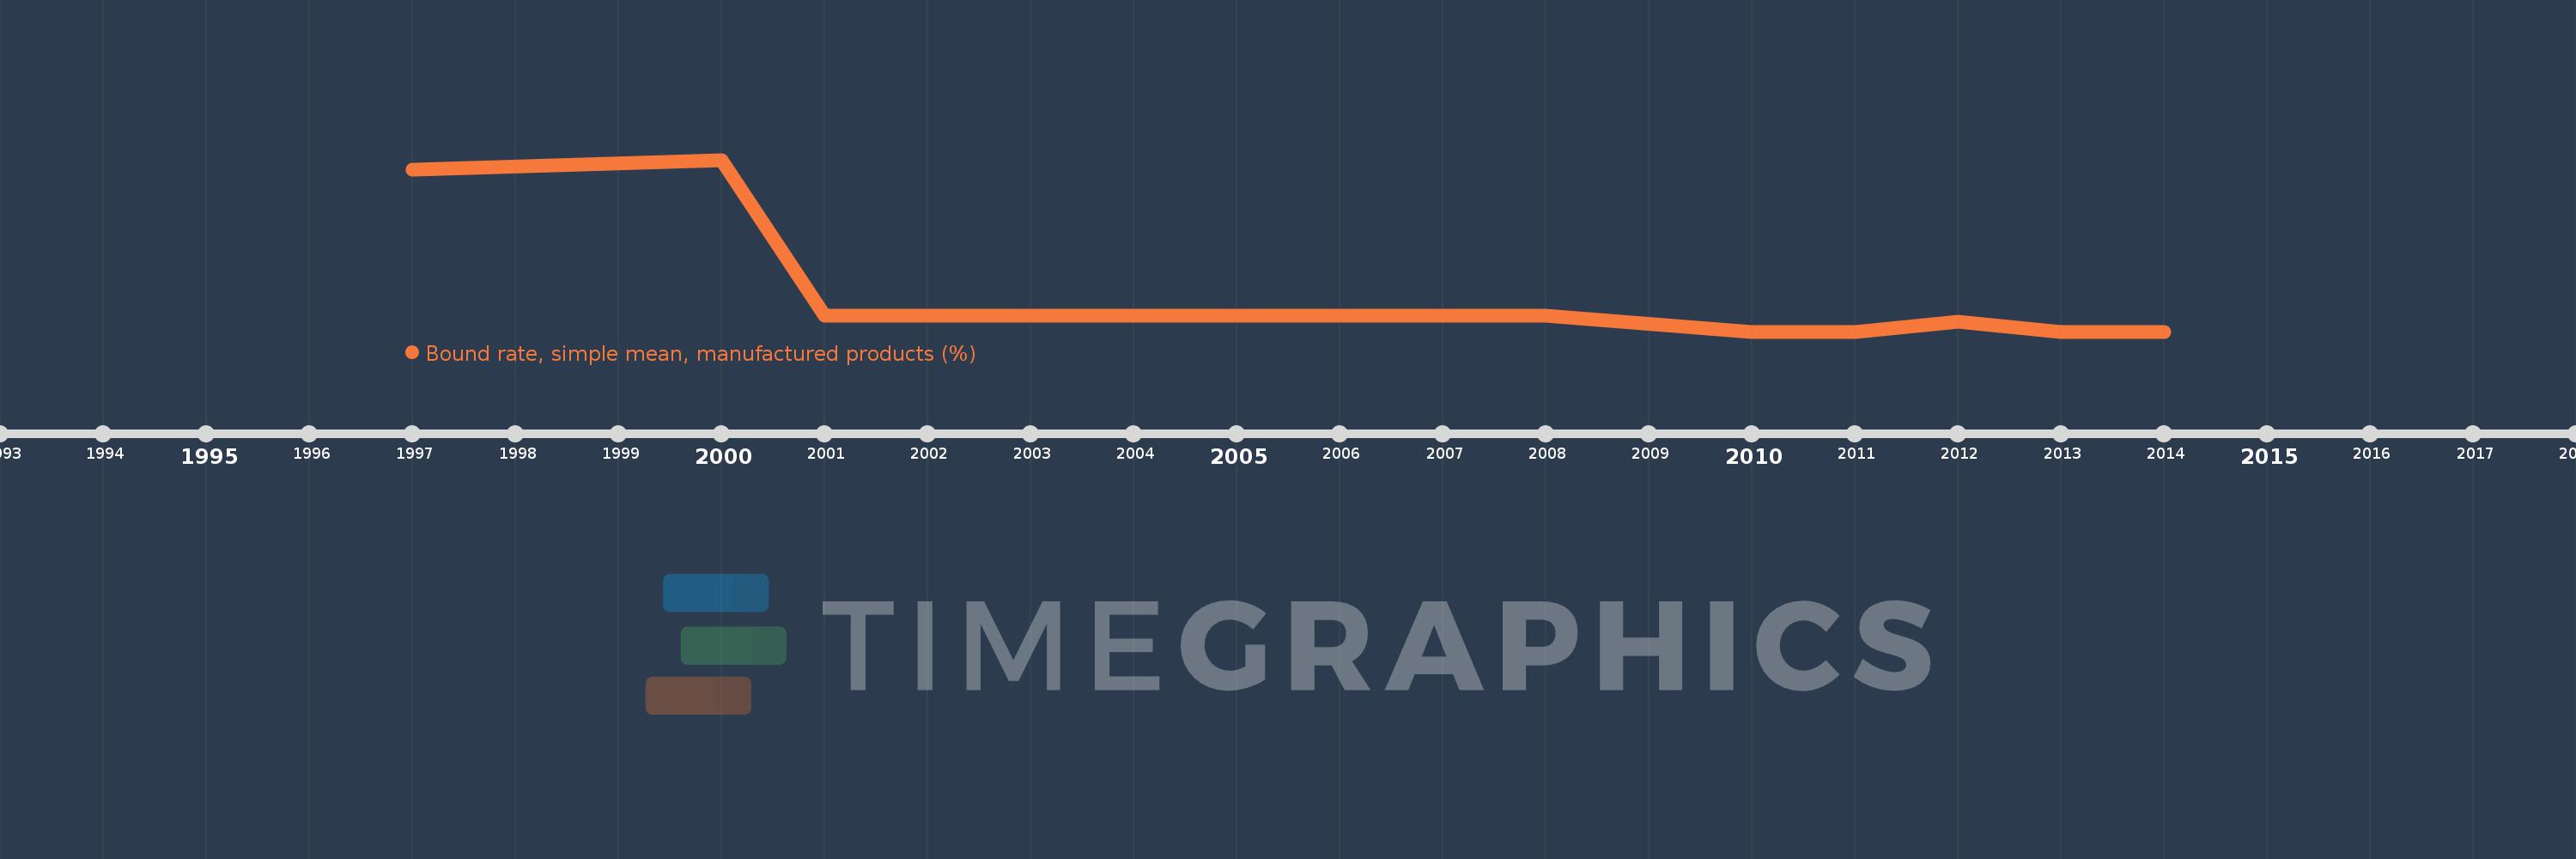
Questa scala temporale mostra un grafico dal 1997 anno al 2014 anno. Suriname. I dati fino ad 1996 anno non disponibili. Il numero di osservazioni attuali secondo i date: 9.
La fonte (nome):
Indicatori dello sviluppo mondiale
La fonte (organizzazione):
World Bank staff estimates using the World Integrated Trade Solution system, based on data from World Trade Organization.
Categorie:
Private Sector, Trade
sono stati aggiornati
23 apr 2017 anni
Indicatori delle variazioni dei valori per anni
In media:
16.521
Minima:
16.31
1 gen 2010 anni
Massimo:
17.18
1 gen 2000 anni
Alla data di osservazione
Valore
Variazione assoluta
La variazione rispetto al valore precedente
1 gen 1997 anni
17.13
+17.13
0.0%
1 gen 2000 anni
17.18
+0.05
0.29%
1 gen 2001 anni
16.39
-0.79
-4.6%
1 gen 2008 anni
16.39
0.0
0.0%
1 gen 2010 anni
16.31
-0.08
-0.49%
1 gen 2011 anni
16.31
0.0
0.0%
1 gen 2012 anni
16.36
+0.05
0.31%
1 gen 2013 anni
16.31
-0.05
-0.31%
1 gen 2014 anni
16.31
0.0
0.0%
Classificazione dei paesi secondo i statistiche attuali per anni