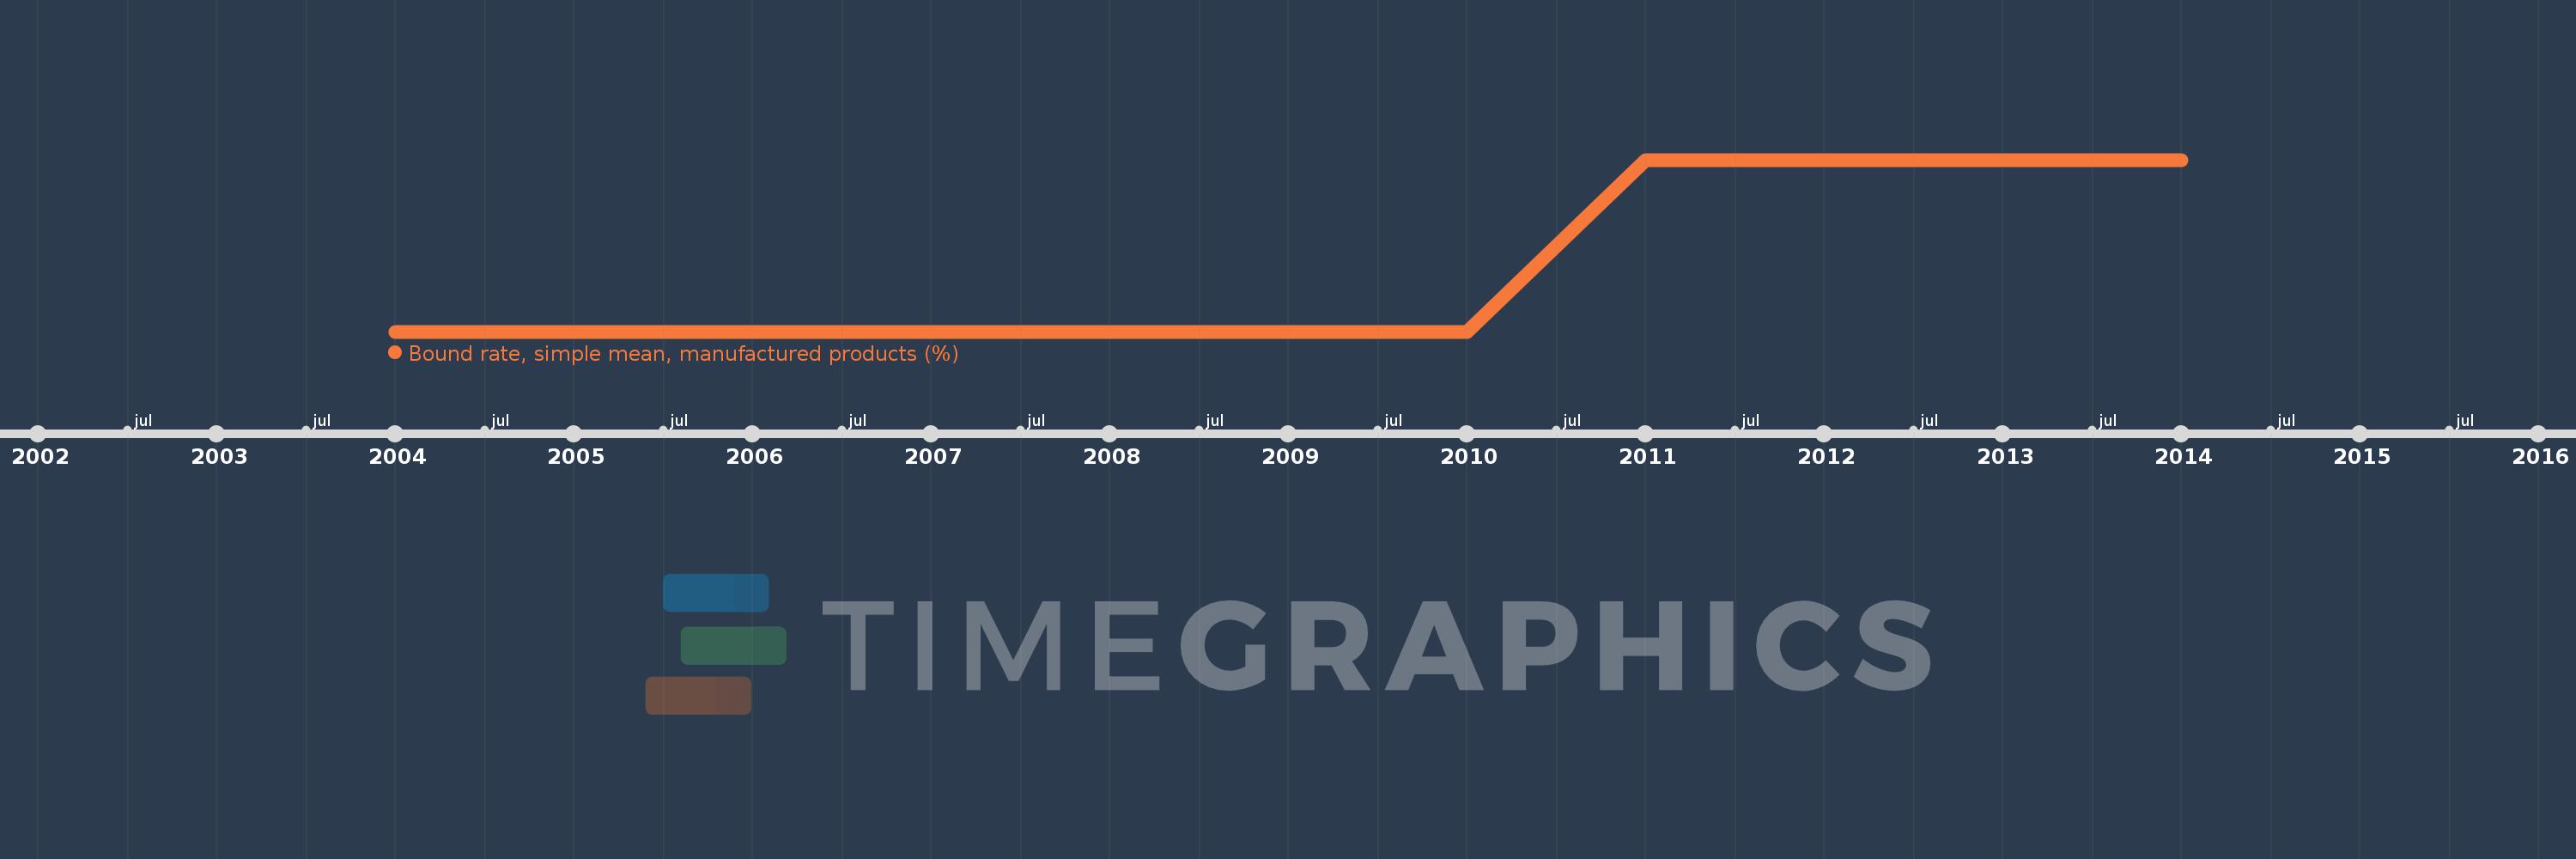
Questa scala temporale mostra un grafico dal 2004 anno al 2014 anno. Gambia, The. I dati fino ad 2003 anno non disponibili. Il numero di osservazioni attuali secondo i date: 8.
La fonte (nome):
Indicatori dello sviluppo mondiale
La fonte (organizzazione):
World Bank staff estimates using the World Integrated Trade Solution system, based on data from World Trade Organization.
Categorie:
Private Sector, Trade
sono stati aggiornati
23 apr 2017 anni
Indicatori delle variazioni dei valori per anni
In media:
61.345
Minima:
53.81
1 gen 2004 anni
Massimo:
68.88
1 gen 2011 anni
Alla data di osservazione
Valore
Variazione assoluta
La variazione rispetto al valore precedente
1 gen 2004 anni
53.81
+53.81
0.0%
1 gen 2008 anni
53.81
0.0
0.0%
1 gen 2009 anni
53.81
0.0
0.0%
1 gen 2010 anni
53.81
0.0
0.0%
1 gen 2011 anni
68.88
+15.07
28.01%
1 gen 2012 anni
68.88
0.0
0.0%
1 gen 2013 anni
68.88
0.0
0.0%
1 gen 2014 anni
68.88
0.0
0.0%
Classificazione dei paesi secondo i statistiche attuali per anni