33
/it/
AIzaSyB4mHJ5NPEv-XzF7P6NDYXjlkCWaeKw5bc
November 30, 2025
252374
St. Vincent and the Grenadines
VCT
true
2
1
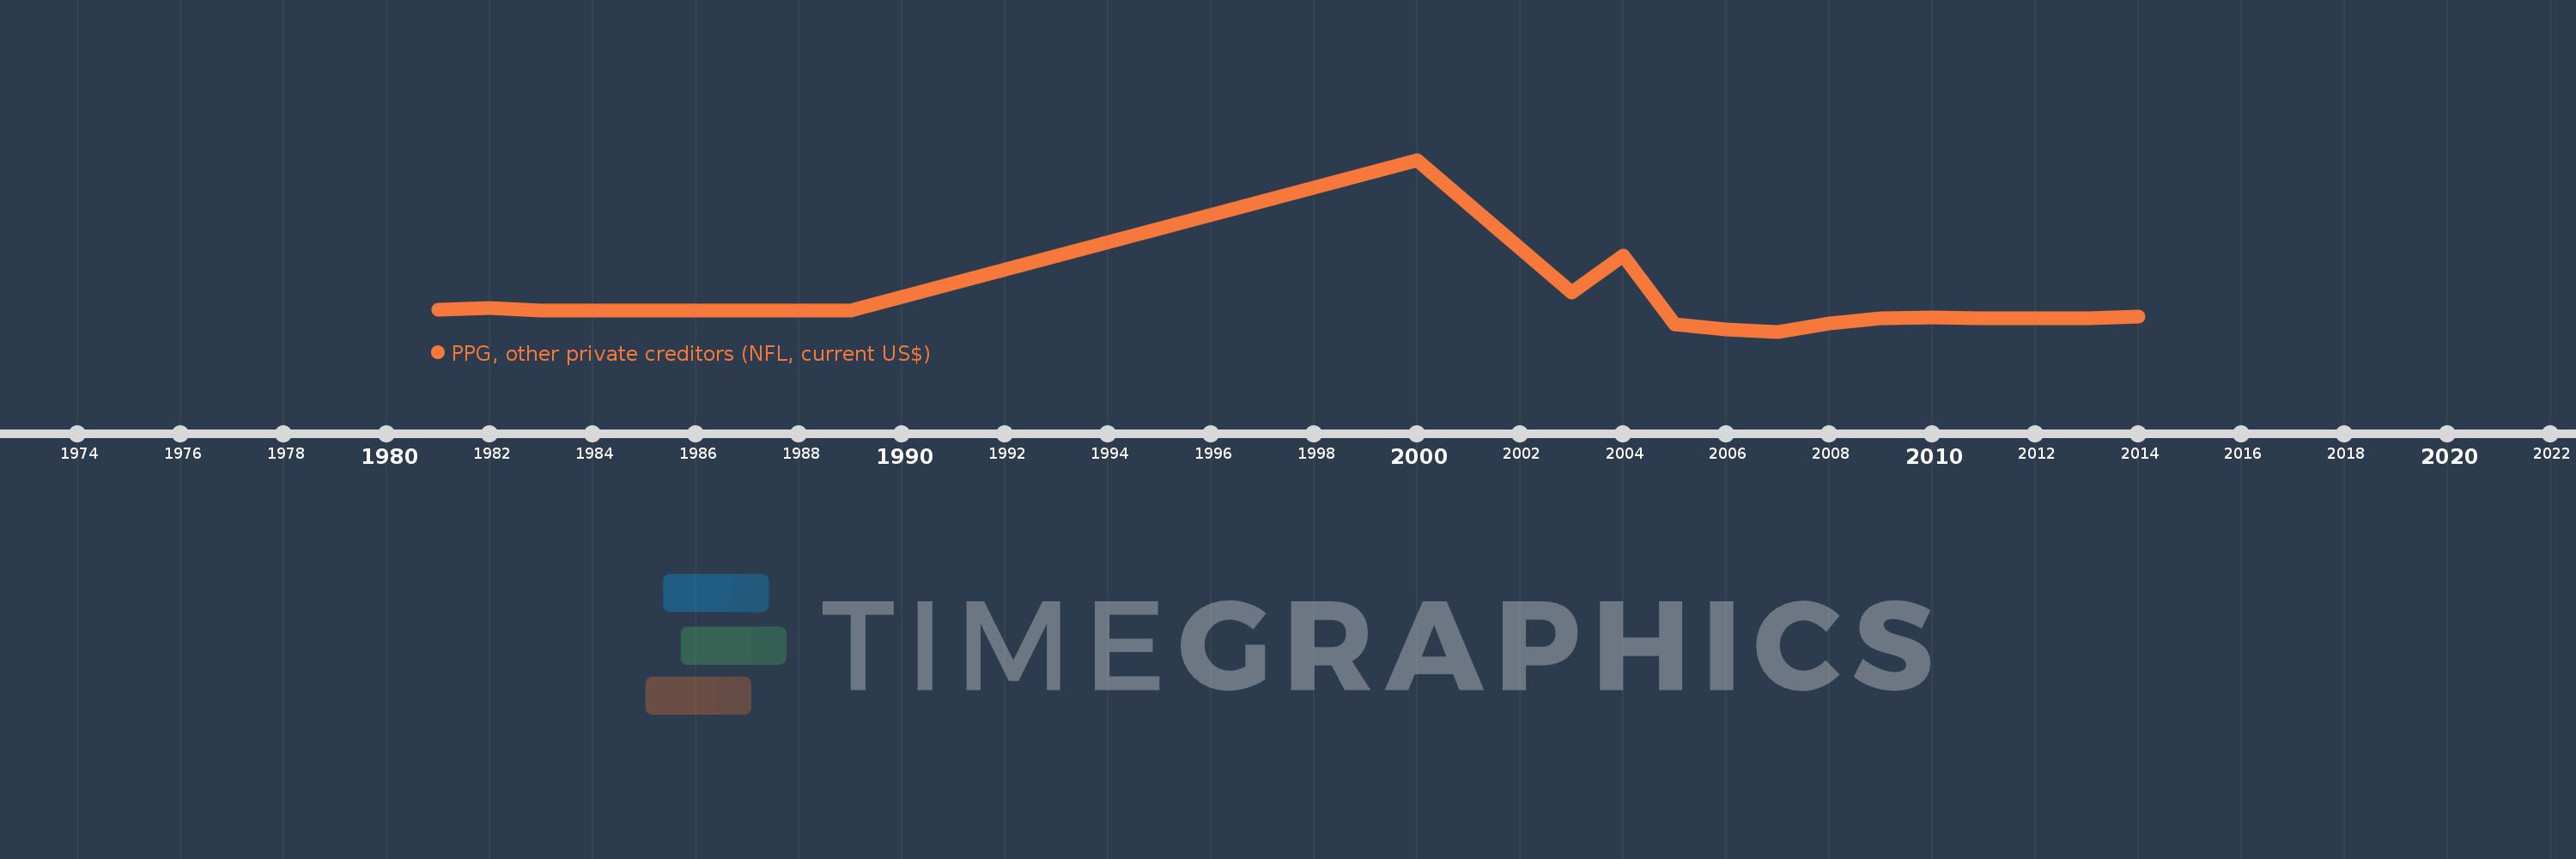
PPG, other private creditors (NFL, current US$)
2014,2013,2012,2011,2010,2009,2008,2007,2006,2005,2004,2003,2000,1989,1988,1987,1986,1985,1984,1983,1982,1981