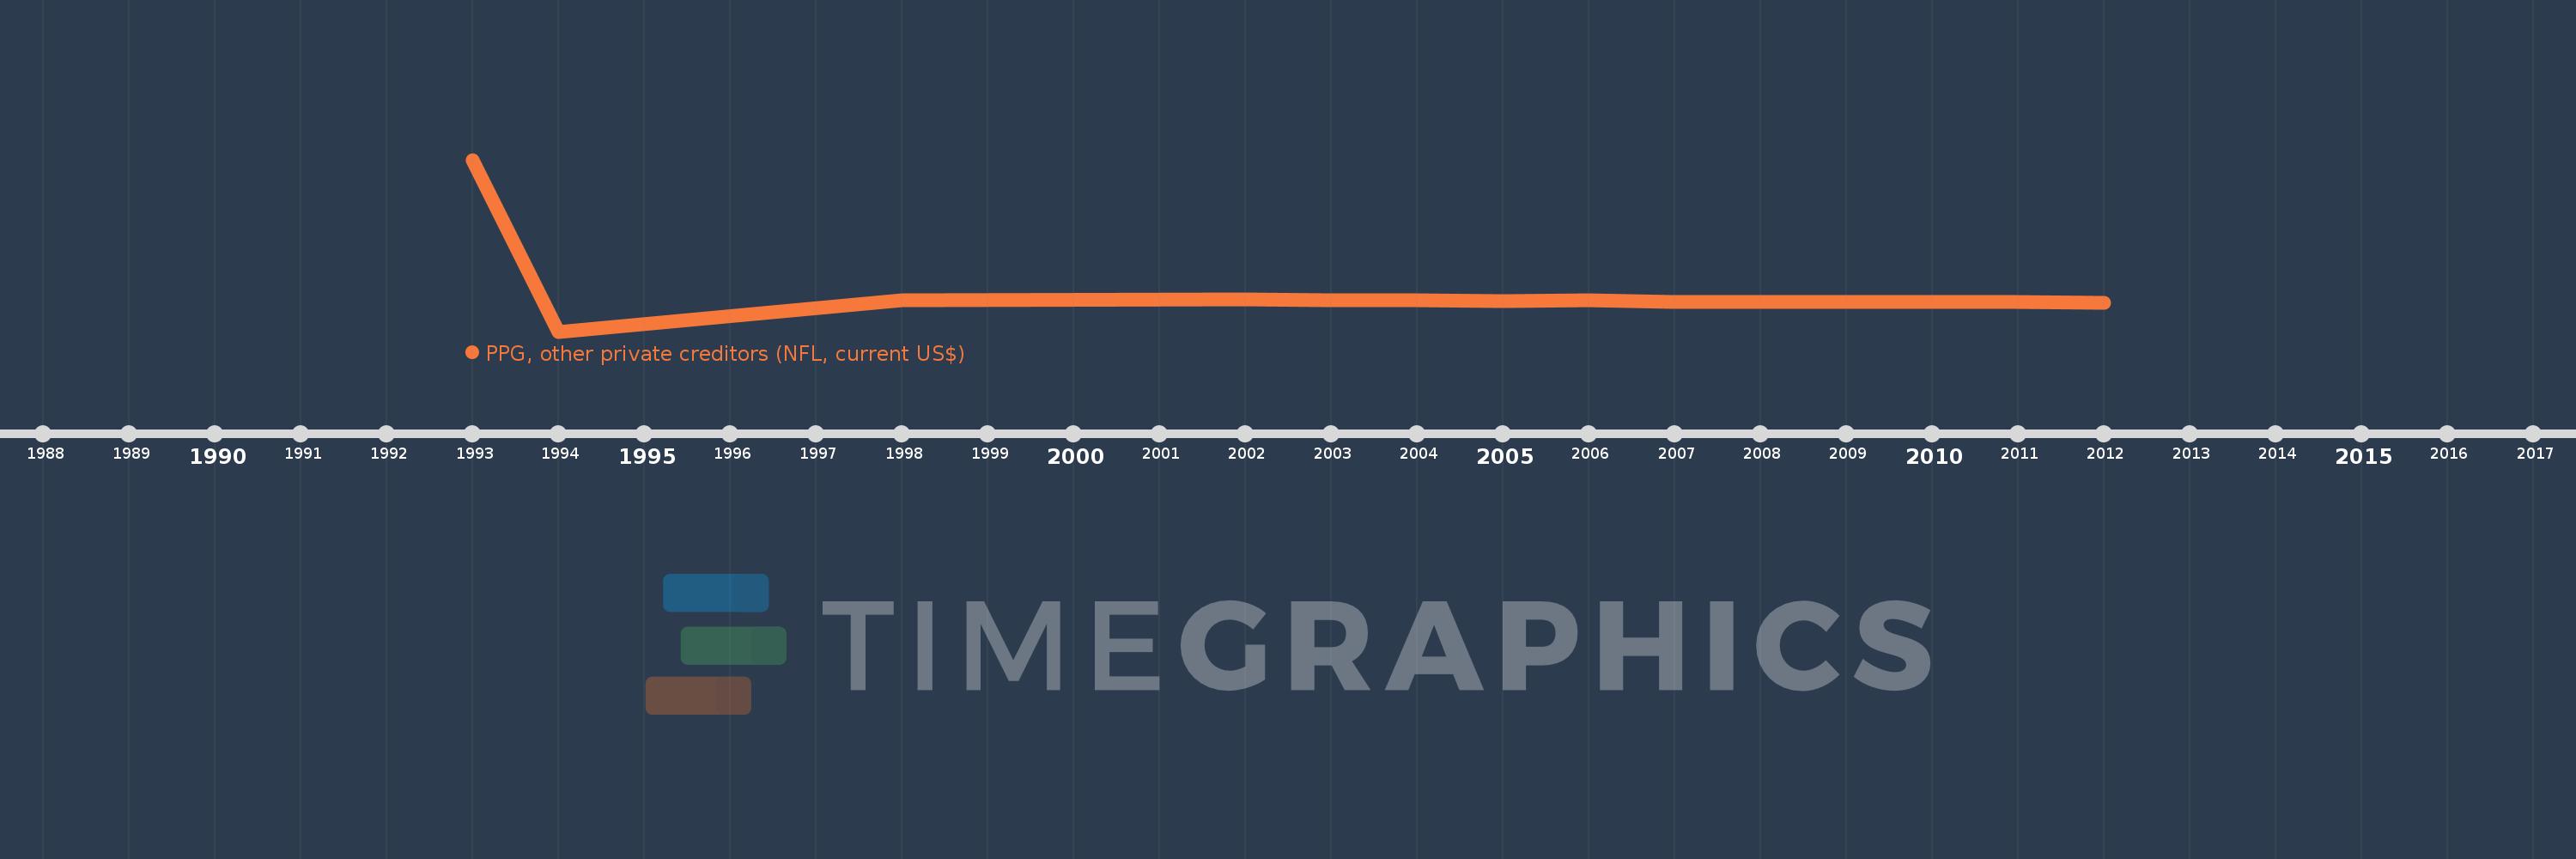
Questa scala temporale mostra un grafico dal 1993 anno al 2012 anno. Georgia. I dati fino ad 1992 anno non disponibili. Il numero di osservazioni attuali secondo i date: 14.
La fonte (nome):
Indicatori dello sviluppo mondiale
La fonte (organizzazione):
World Bank, International Debt Statistics.
Categorie:
External Debt
sono stati aggiornati
23 apr 2017 anni
Indicatori delle variazioni dei valori per anni
In media:
898.286 Mille.
Minima:
-4.729 Mln
1 gen 1994 anni
Massimo:
20.524 Mln
1 gen 1993 anni
Alla data di osservazione
Valore
Variazione assoluta
La variazione rispetto al valore precedente
1 gen 1993 anni
20.524 Mln
+20.524 Mln
0.0%
1 gen 1994 anni
-4.729 Mln
-25.253 Mln
-123.04%
1 gen 1998 anni
-84.0 Mille.
+4.645 Mln
-98.22%
1 gen 2002 anni
-43.0 Mille.
+41.0 Mille.
-48.81%
1 gen 2003 anni
-110.0 Mille.
-67.0 Mille.
155.81%
1 gen 2004 anni
-162.0 Mille.
-52.0 Mille.
47.27%
1 gen 2005 anni
-210.0 Mille.
-48.0 Mille.
29.63%
1 gen 2006 anni
-118.0 Mille.
+92.0 Mille.
-43.81%
1 gen 2007 anni
-406.0 Mille.
-288.0 Mille.
244.07%
1 gen 2008 anni
-340.0 Mille.
+66.0 Mille.
-16.26%
1 gen 2009 anni
-405.0 Mille.
-65.0 Mille.
19.12%
1 gen 2010 anni
-419.0 Mille.
-14.0 Mille.
3.46%
1 gen 2011 anni
-434.0 Mille.
-15.0 Mille.
3.58%
1 gen 2012 anni
-488.0 Mille.
-54.0 Mille.
12.44%
Classificazione dei paesi secondo i statistiche attuali per anni