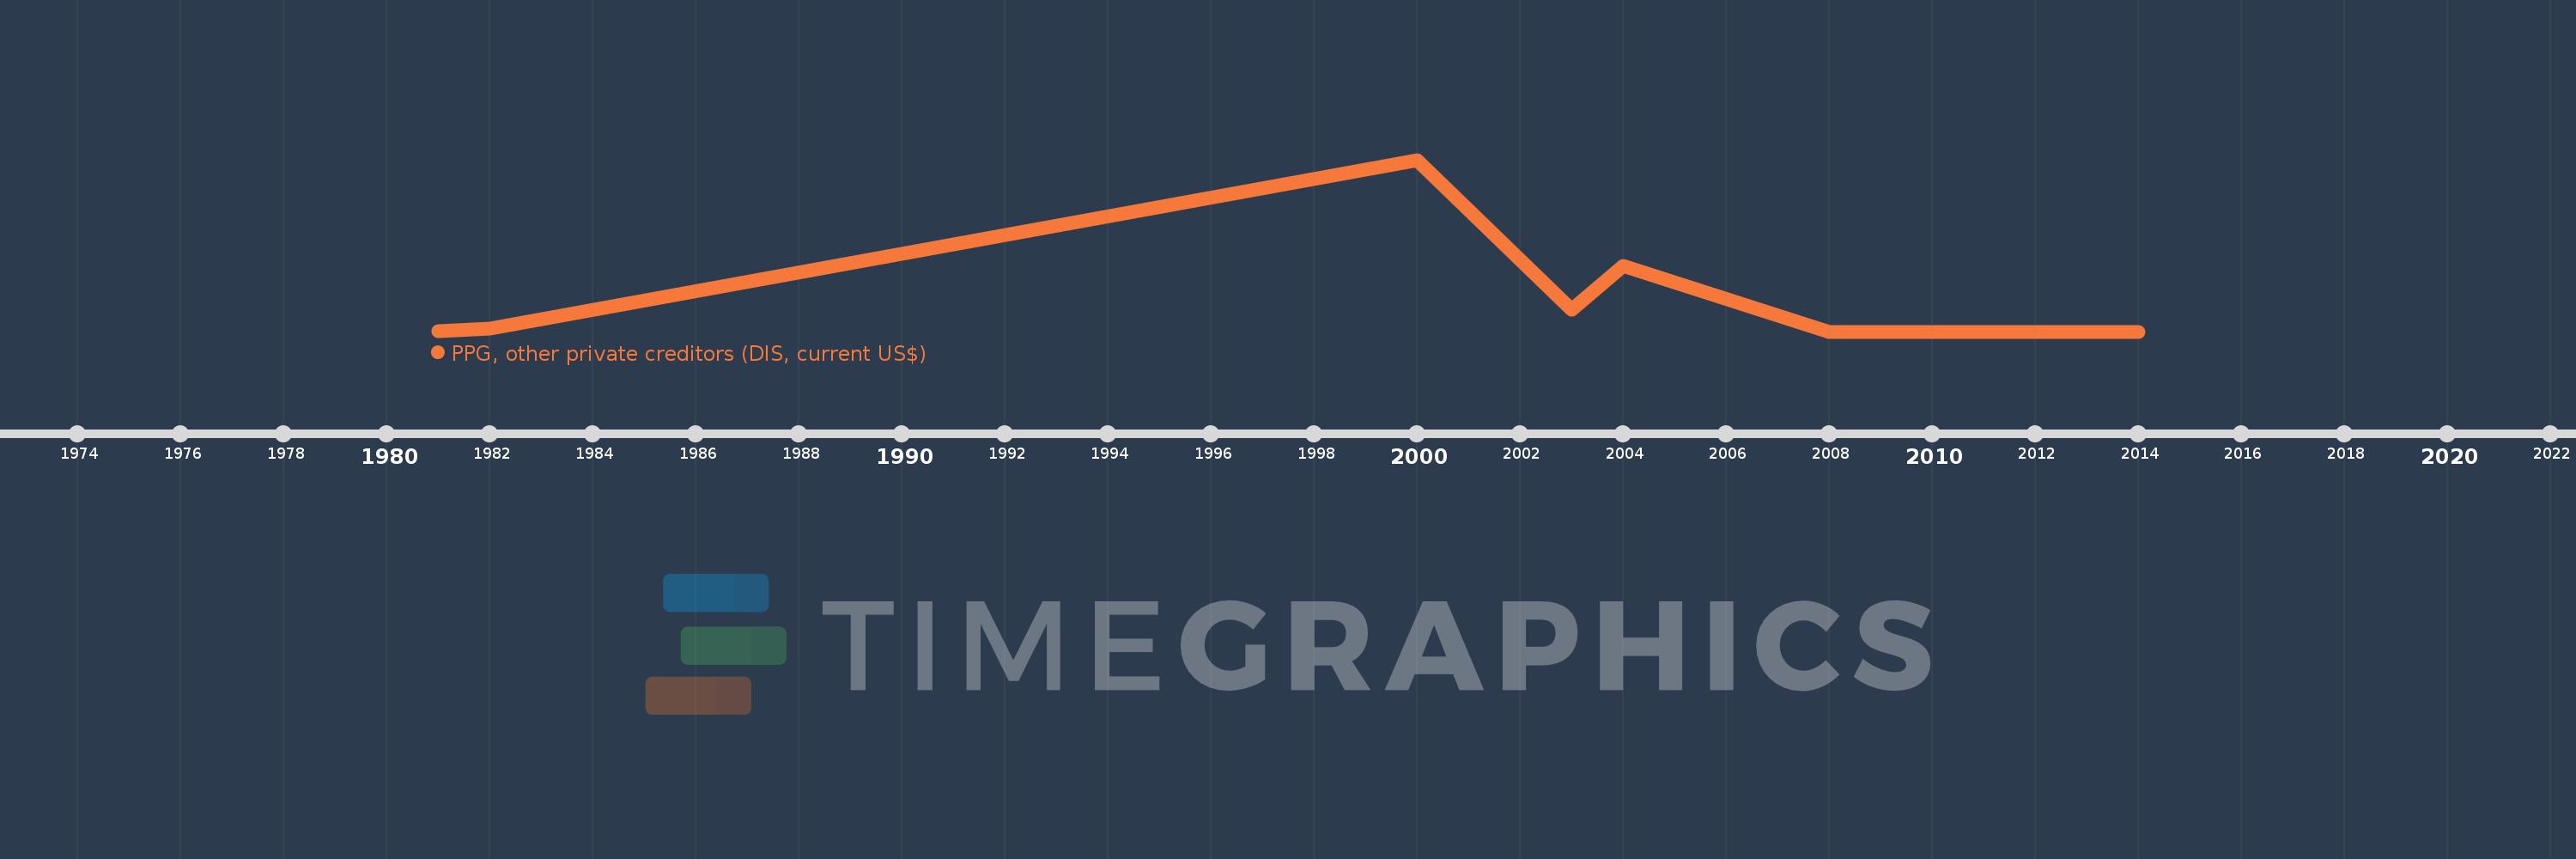
Questa scala temporale mostra un grafico dal 1981 anno al 2014 anno. St. Vincent and the Grenadines. I dati fino ad 1980 anno non disponibili. Il numero di osservazioni attuali secondo i date: 9.
La fonte (nome):
Indicatori dello sviluppo mondiale
La fonte (organizzazione):
World Bank, International Debt Statistics.
Categorie:
External Debt
sono stati aggiornati
23 apr 2017 anni
Indicatori delle variazioni dei valori per anni
In media:
9.863 Mln
Minima:
0.0
1 gen 2008 anni
Massimo:
57.882 Mln
1 gen 2000 anni
Alla data di osservazione
Valore
Variazione assoluta
La variazione rispetto al valore precedente
1 gen 1981 anni
135.0 Mille.
+135.0 Mille.
0.0%
1 gen 1982 anni
1.026 Mln
+891.0 Mille.
660.0%
1 gen 2000 anni
57.882 Mln
+56.856 Mln
5.54 Mille.%
1 gen 2003 anni
7.5 Mln
-50.382 Mln
-87.04%
1 gen 2004 anni
22.222 Mln
+14.722 Mln
196.29%
1 gen 2008 anni
0.0
-22.222 Mln
-100.0%
1 gen 2012 anni
0.0
0.0
%
1 gen 2013 anni
0.0
0.0
%
1 gen 2014 anni
0.0
0.0
%
Classificazione dei paesi secondo i statistiche attuali per anni