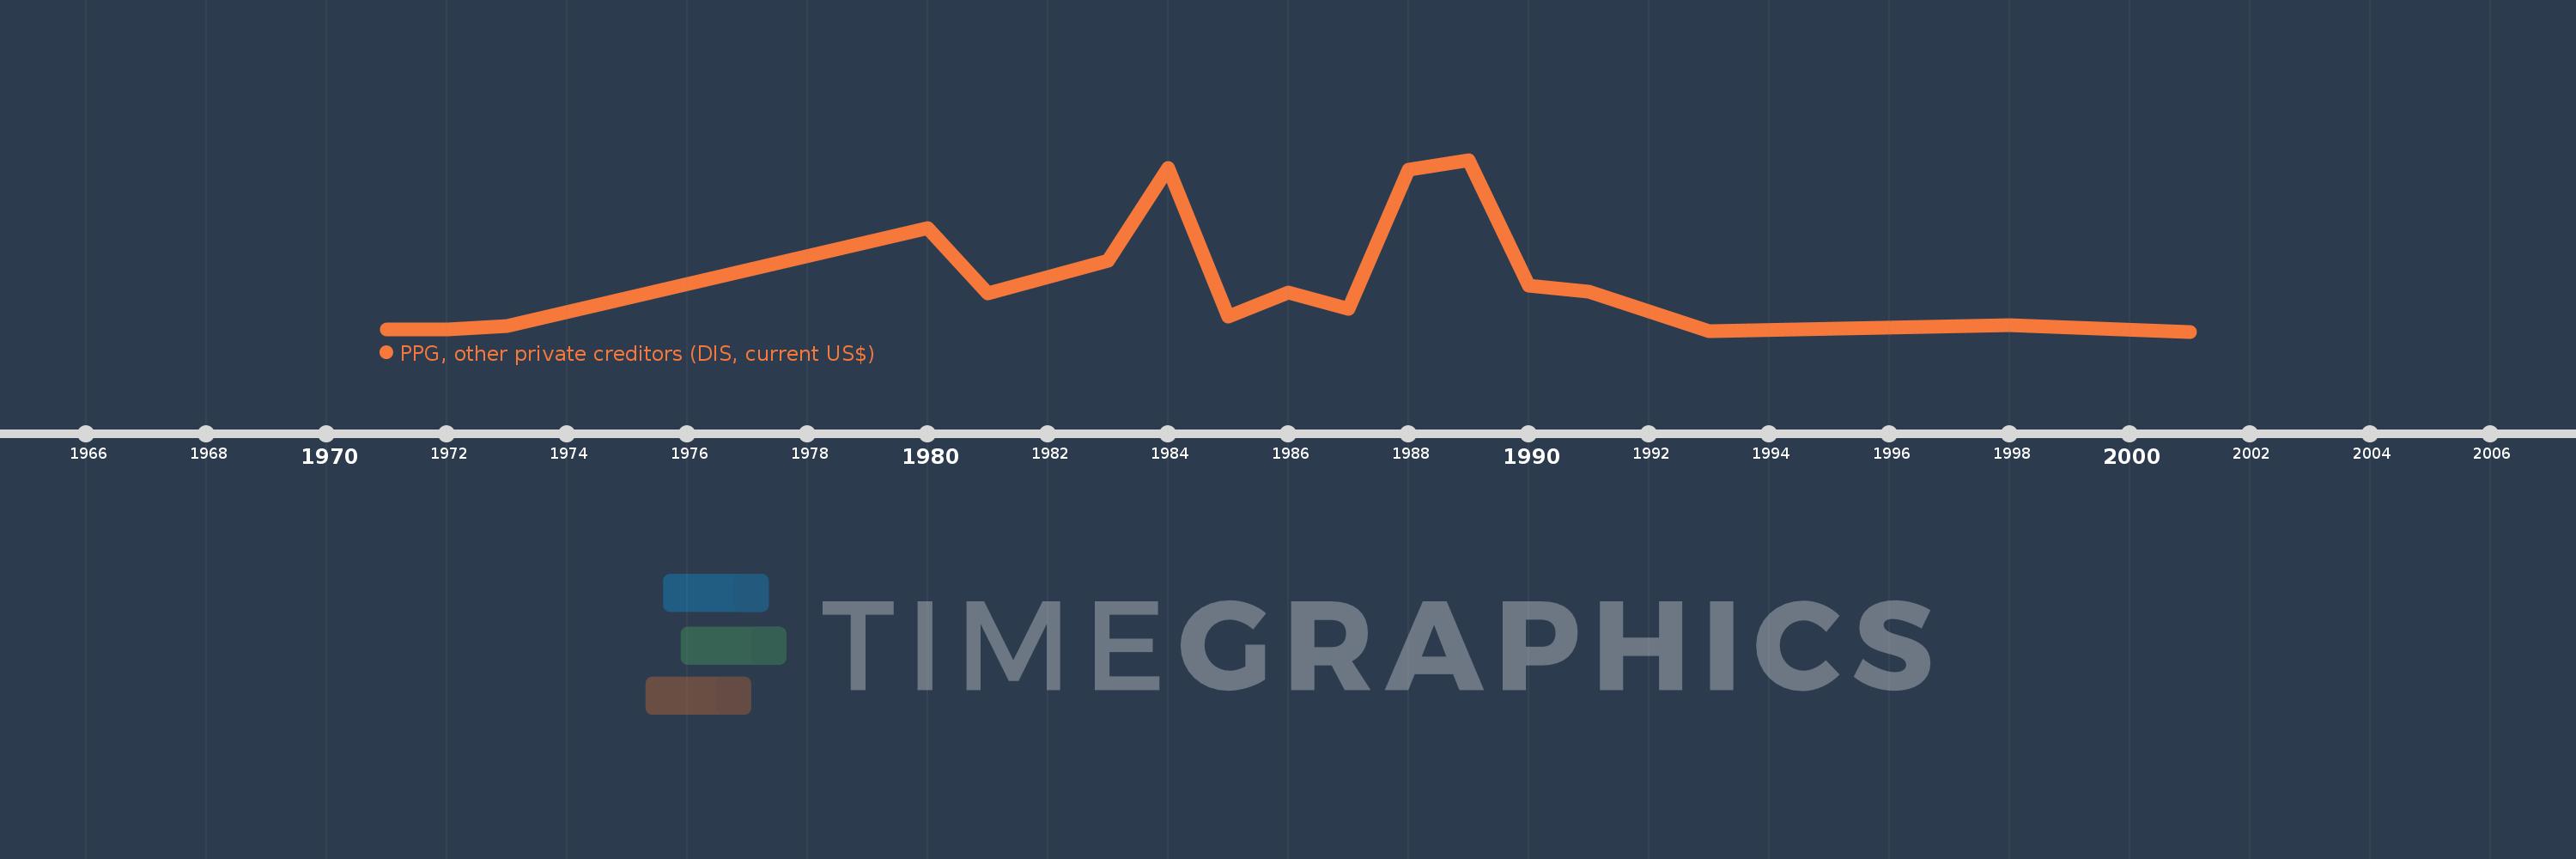
Questa scala temporale mostra un grafico dal 1971 anno al 2001 anno. Lesotho. I dati fino ad 1970 anno non disponibili. Il numero di osservazioni attuali secondo i date: 17.
La fonte (nome):
Indicatori dello sviluppo mondiale
La fonte (organizzazione):
World Bank, International Debt Statistics.
Categorie:
External Debt
sono stati aggiornati
23 apr 2017 anni
Indicatori delle variazioni dei valori per anni
In media:
4.558 Mln
Minima:
0.0
1 gen 2001 anni
Massimo:
14.965 Mln
1 gen 1989 anni
Alla data di osservazione
Valore
Variazione assoluta
La variazione rispetto al valore precedente
1 gen 1971 anni
162.0 Mille.
+162.0 Mille.
0.0%
1 gen 1972 anni
218.0 Mille.
+56.0 Mille.
34.57%
1 gen 1973 anni
455.0 Mille.
+237.0 Mille.
108.72%
1 gen 1980 anni
9.037 Mln
+8.582 Mln
1.89 Mille.%
1 gen 1981 anni
3.3 Mln
-5.737 Mln
-63.48%
1 gen 1983 anni
6.175 Mln
+2.875 Mln
87.12%
1 gen 1984 anni
14.281 Mln
+8.106 Mln
131.27%
1 gen 1985 anni
1.274 Mln
-13.007 Mln
-91.08%
1 gen 1986 anni
3.435 Mln
+2.161 Mln
169.62%
1 gen 1987 anni
1.953 Mln
-1.482 Mln
-43.14%
1 gen 1988 anni
14.106 Mln
+12.153 Mln
622.27%
1 gen 1989 anni
14.965 Mln
+859.0 Mille.
6.09%
1 gen 1990 anni
4.025 Mln
-10.94 Mln
-73.1%
1 gen 1991 anni
3.467 Mln
-558.0 Mille.
-13.86%
1 gen 1993 anni
33.0 Mille.
-3.434 Mln
-99.05%
1 gen 1998 anni
597.0 Mille.
+564.0 Mille.
1.71 Mille.%
1 gen 2001 anni
0.0
-597.0 Mille.
-100.0%
Classificazione dei paesi secondo i statistiche attuali per anni