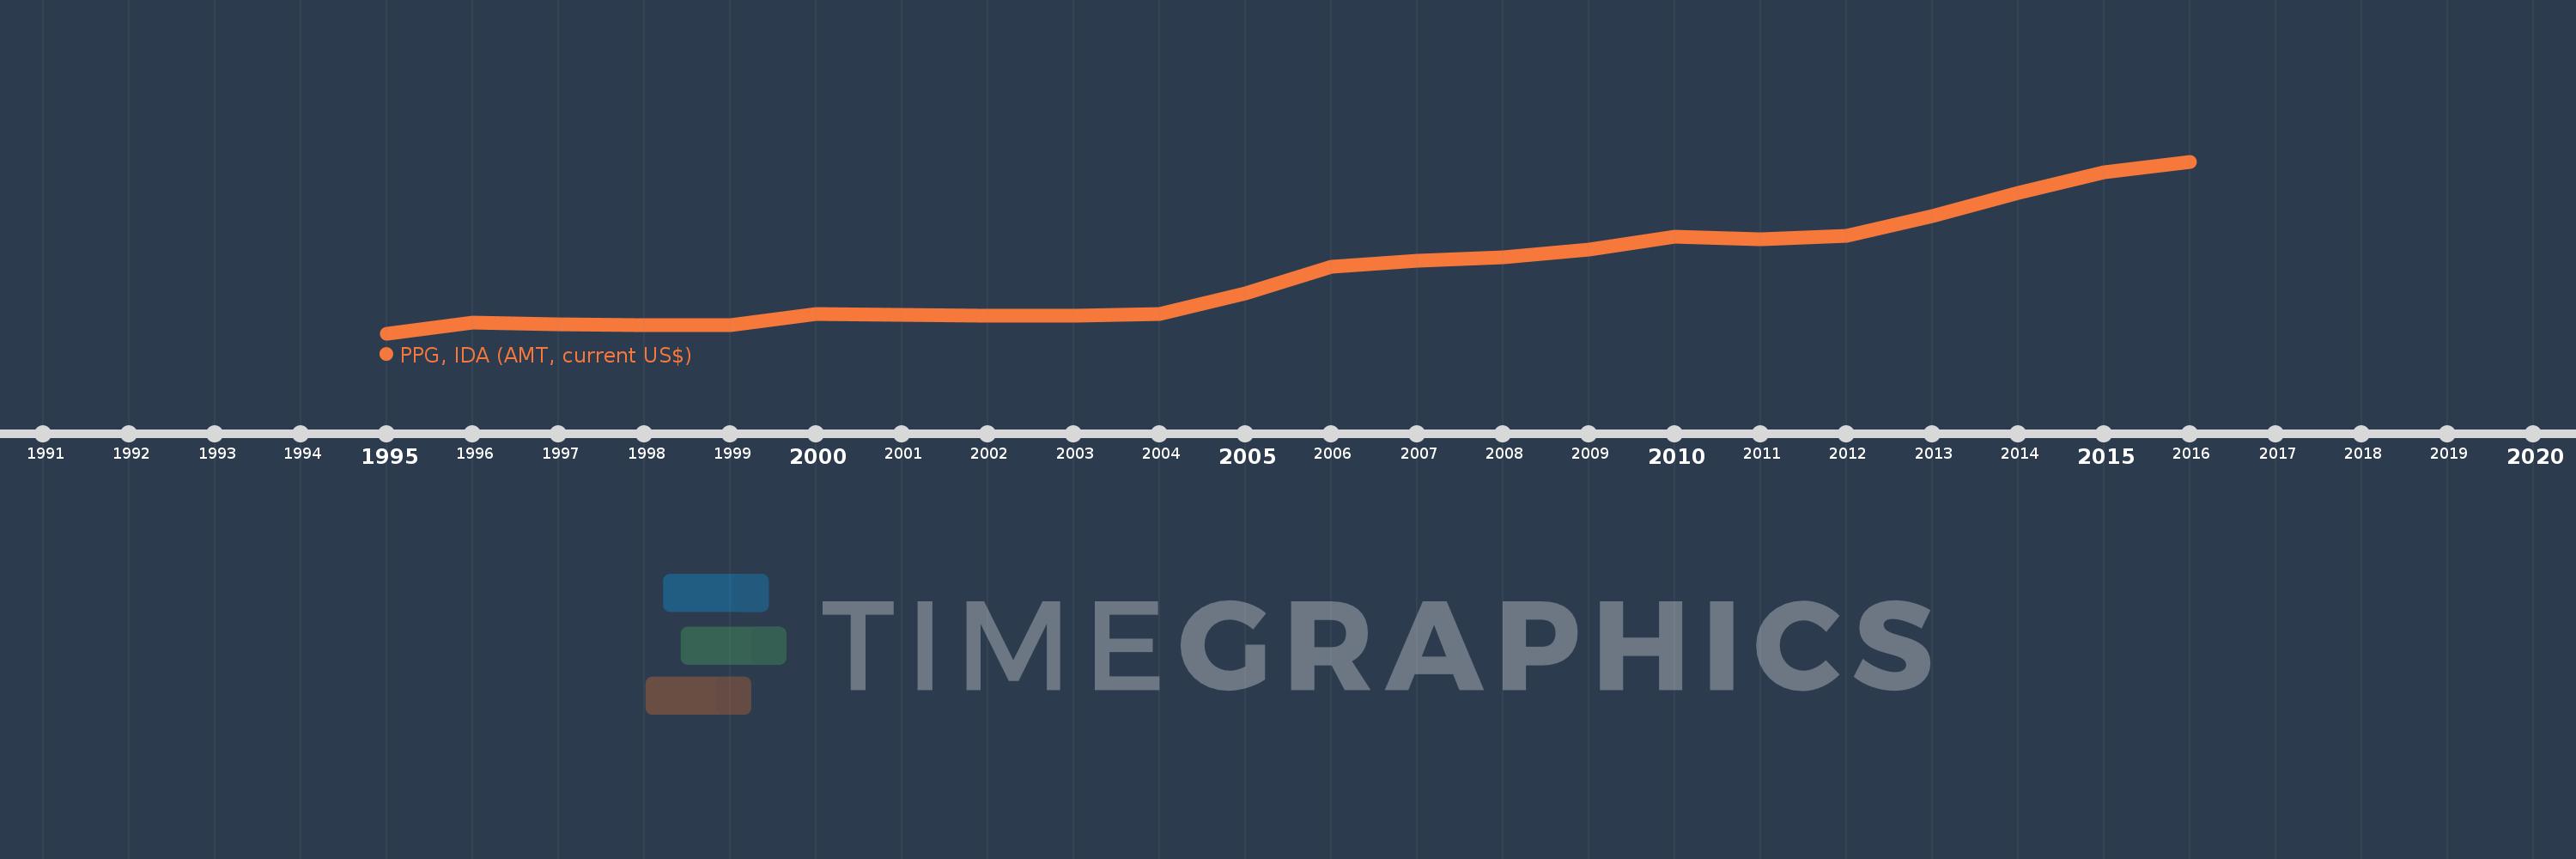
Questa scala temporale mostra un grafico dal 1995 anno al 2016 anno. St. Vincent and the Grenadines. I dati fino ad 1994 anno non disponibili. Il numero di osservazioni attuali secondo i date: 22.
La fonte (nome):
Indicatori dello sviluppo mondiale
La fonte (organizzazione):
World Bank, International Debt Statistics.
Categorie:
External Debt
sono stati aggiornati
23 apr 2017 anni
Indicatori delle variazioni dei valori per anni
In media:
241.591 Mille.
Minima:
32.0 Mille.
1 gen 1995 anni
Massimo:
620.0 Mille.
1 gen 2016 anni
Alla data di osservazione
Valore
Variazione assoluta
La variazione rispetto al valore precedente
1 gen 1995 anni
32.0 Mille.
+32.0 Mille.
0.0%
1 gen 1996 anni
68.0 Mille.
+36.0 Mille.
112.5%
1 gen 1997 anni
64.0 Mille.
-4.0 Mille.
-5.88%
1 gen 1998 anni
61.0 Mille.
-3.0 Mille.
-4.69%
1 gen 1999 anni
60.0 Mille.
-1000.0
-1.64%
1 gen 2000 anni
98.0 Mille.
+38.0 Mille.
63.33%
1 gen 2001 anni
96.0 Mille.
-2.0 Mille.
-2.04%
1 gen 2002 anni
92.0 Mille.
-4.0 Mille.
-4.17%
1 gen 2003 anni
92.0 Mille.
0.0
0.0%
1 gen 2004 anni
99.0 Mille.
+7.0 Mille.
7.61%
1 gen 2005 anni
170.0 Mille.
+71.0 Mille.
71.72%
1 gen 2006 anni
261.0 Mille.
+91.0 Mille.
53.53%
1 gen 2007 anni
281.0 Mille.
+20.0 Mille.
7.66%
1 gen 2008 anni
293.0 Mille.
+12.0 Mille.
4.27%
1 gen 2009 anni
318.0 Mille.
+25.0 Mille.
8.53%
1 gen 2010 anni
362.0 Mille.
+44.0 Mille.
13.84%
1 gen 2011 anni
353.0 Mille.
-9.0 Mille.
-2.49%
1 gen 2012 anni
366.0 Mille.
+13.0 Mille.
3.68%
1 gen 2013 anni
433.0 Mille.
+67.0 Mille.
18.31%
1 gen 2014 anni
513.0 Mille.
+80.0 Mille.
18.48%
1 gen 2015 anni
583.0 Mille.
+70.0 Mille.
13.65%
1 gen 2016 anni
620.0 Mille.
+37.0 Mille.
6.35%
Classificazione dei paesi secondo i statistiche attuali per anni