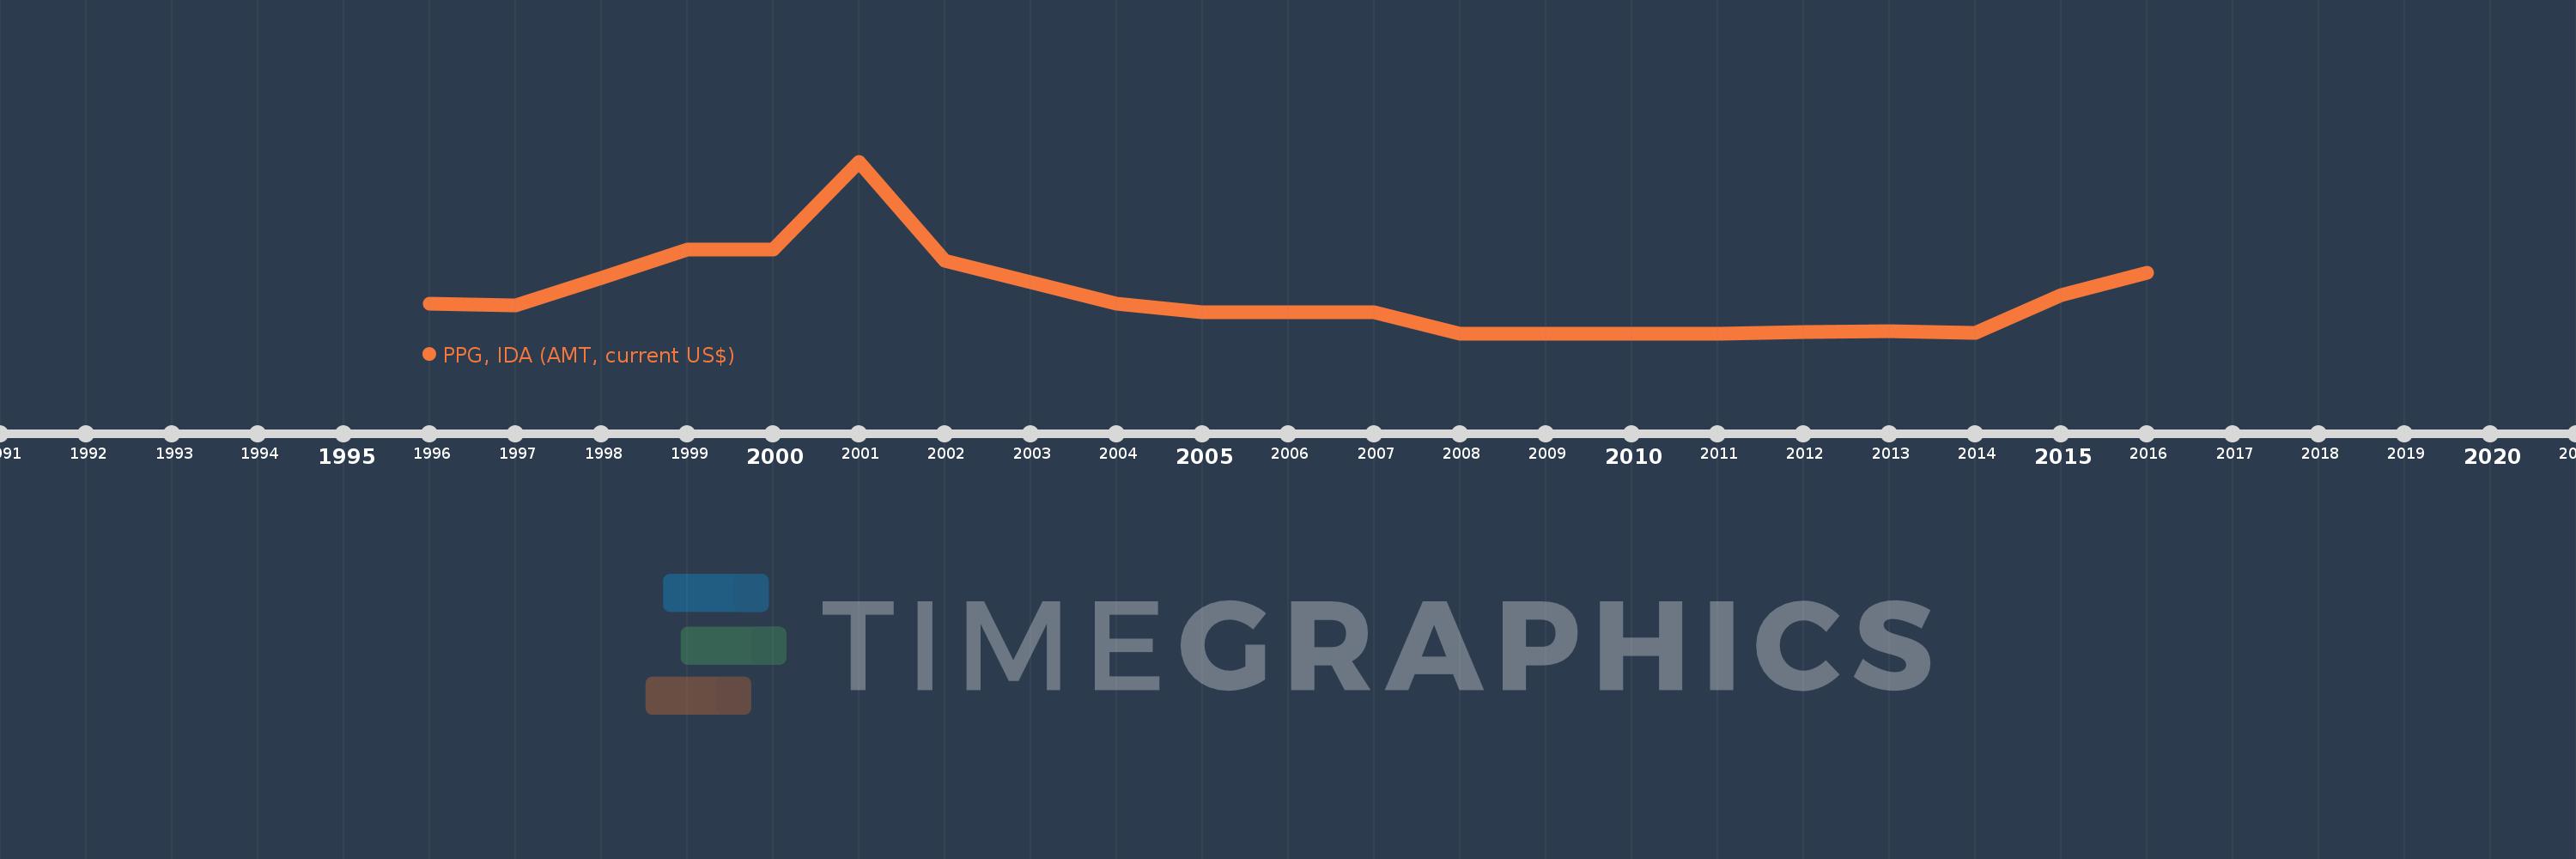
Questa scala temporale mostra un grafico dal 1996 anno al 2016 anno. Sao Tome and Principe. I dati fino ad 1995 anno non disponibili. Il numero di osservazioni attuali secondo i date: 18.
La fonte (nome):
Indicatori dello sviluppo mondiale
La fonte (organizzazione):
World Bank, International Debt Statistics.
Categorie:
External Debt
sono stati aggiornati
23 apr 2017 anni
Indicatori delle variazioni dei valori per anni
In media:
109.0 Mille.
Minima:
0.0
1 gen 2008 anni
Massimo:
469.0 Mille.
1 gen 2001 anni
Alla data di osservazione
Valore
Variazione assoluta
La variazione rispetto al valore precedente
1 gen 1996 anni
80.0 Mille.
+80.0 Mille.
0.0%
1 gen 1997 anni
76.0 Mille.
-4.0 Mille.
-5.0%
1 gen 1998 anni
151.0 Mille.
+75.0 Mille.
98.68%
1 gen 1999 anni
228.0 Mille.
+77.0 Mille.
50.99%
1 gen 2000 anni
228.0 Mille.
0.0
0.0%
1 gen 2001 anni
469.0 Mille.
+241.0 Mille.
105.7%
1 gen 2002 anni
198.0 Mille.
-271.0 Mille.
-57.78%
1 gen 2004 anni
80.0 Mille.
-118.0 Mille.
-59.6%
1 gen 2005 anni
57.0 Mille.
-23.0 Mille.
-28.75%
1 gen 2006 anni
58.0 Mille.
+1000.0
1.75%
1 gen 2007 anni
57.0 Mille.
-1000.0
-1.72%
1 gen 2008 anni
0.0
-57.0 Mille.
-100.0%
1 gen 2011 anni
0.0
0.0
%
1 gen 2012 anni
3.0 Mille.
+3.0 Mille.
%
1 gen 2013 anni
7.0 Mille.
+4.0 Mille.
133.33%
1 gen 2014 anni
1000.0
-6.0 Mille.
-85.71%
1 gen 2015 anni
104.0 Mille.
+103.0 Mille.
10.3 Mille.%
1 gen 2016 anni
165.0 Mille.
+61.0 Mille.
58.65%
Classificazione dei paesi secondo i statistiche attuali per anni