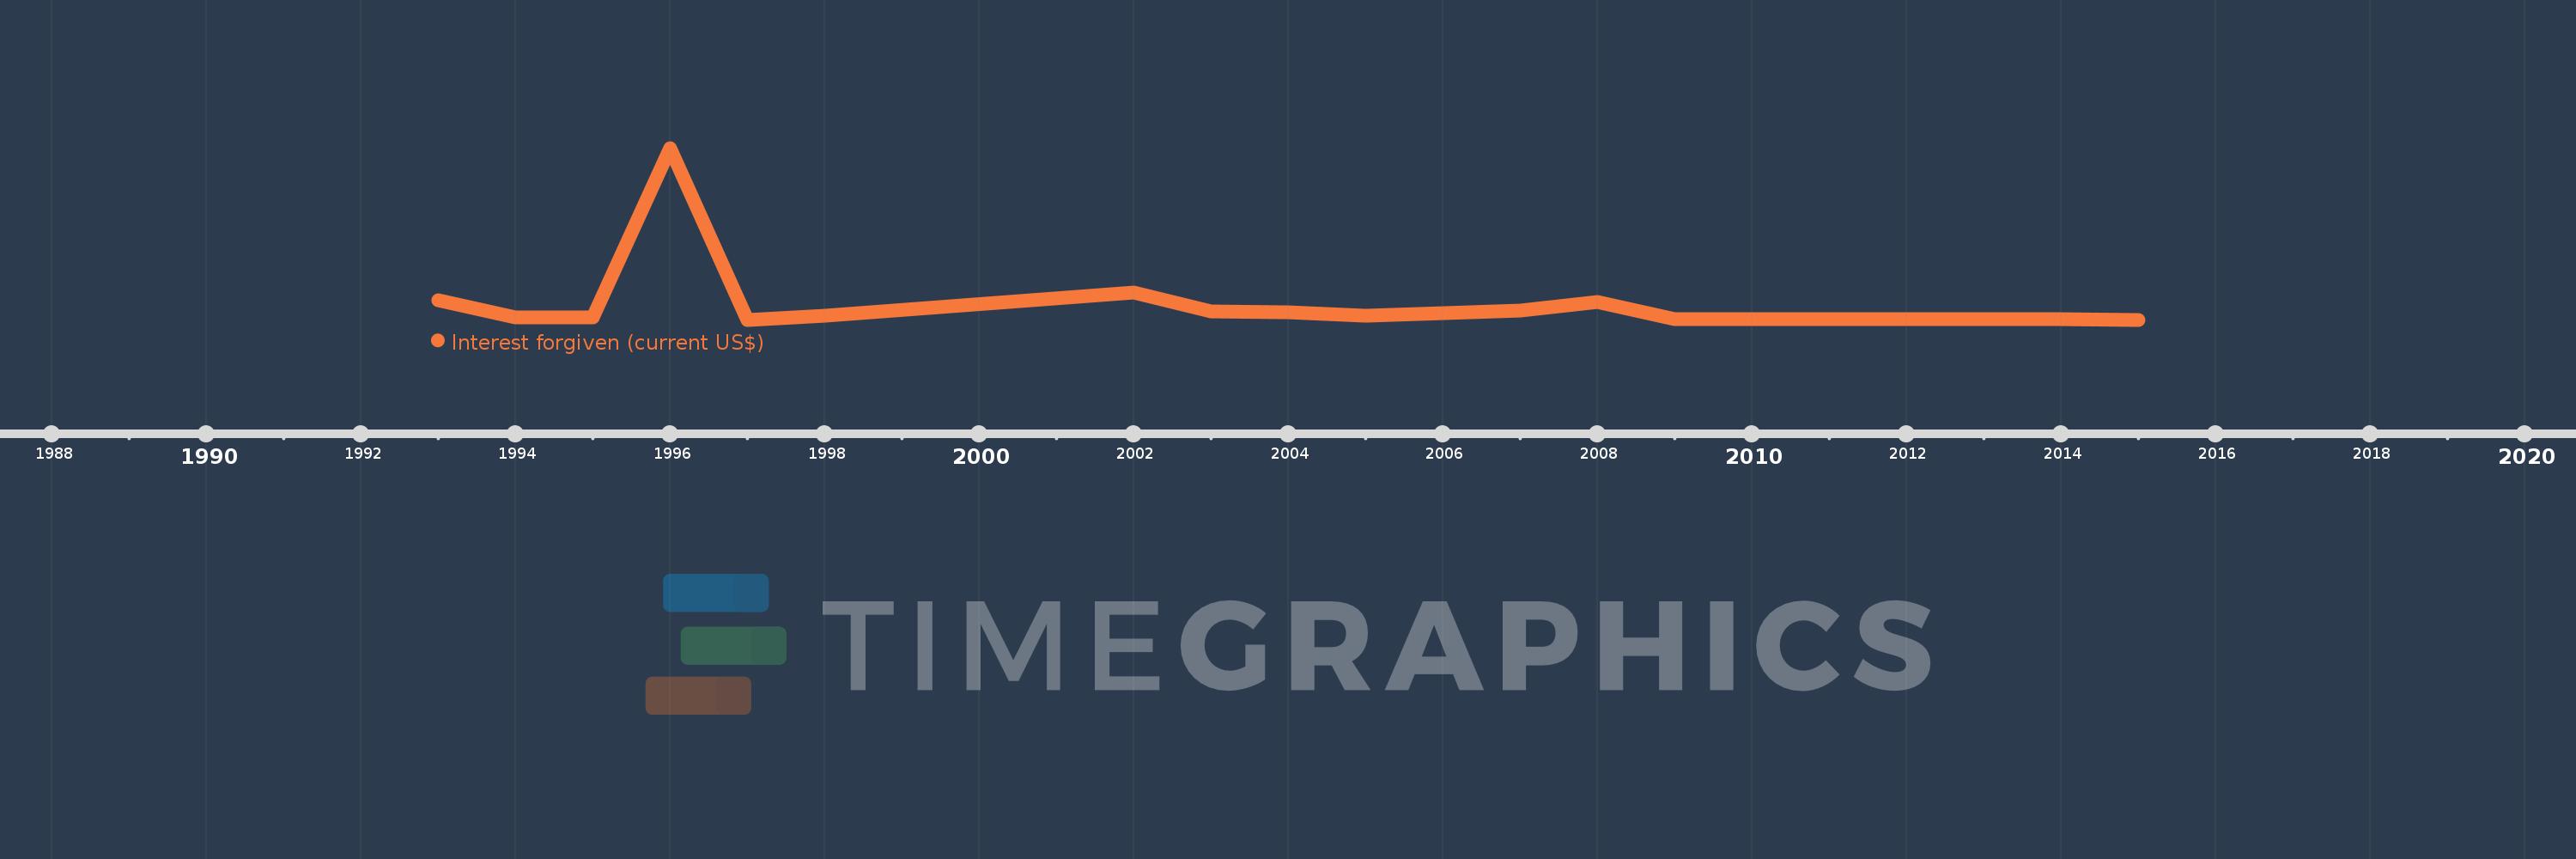
Questa scala temporale mostra un grafico dal 1993 anno al 2015 anno. Sierra Leone. I dati fino ad 1992 anno non disponibili. Il numero di osservazioni attuali secondo i date: 20.
La fonte (nome):
Indicatori dello sviluppo mondiale
La fonte (organizzazione):
World Bank, International Debt Statistics.
Categorie:
External Debt
sono stati aggiornati
23 apr 2017 anni
Indicatori delle variazioni dei valori per anni
In media:
9.92 Mln
Minima:
128.0 Mille.
1 gen 1997 anni
Massimo:
118.919 Mln
1 gen 1996 anni
Alla data di osservazione
Valore
Variazione assoluta
La variazione rispetto al valore precedente
1 gen 1993 anni
13.516 Mln
+13.516 Mln
0.0%
1 gen 1994 anni
1.971 Mln
-11.545 Mln
-85.42%
1 gen 1995 anni
1.594 Mln
-377.0 Mille.
-19.13%
1 gen 1996 anni
118.919 Mln
+117.325 Mln
7.36 Mille.%
1 gen 1997 anni
128.0 Mille.
-118.791 Mln
-99.89%
1 gen 1998 anni
2.798 Mln
+2.67 Mln
2.09 Mille.%
1 gen 2002 anni
18.969 Mln
+16.171 Mln
577.95%
1 gen 2003 anni
6.154 Mln
-12.815 Mln
-67.56%
1 gen 2004 anni
5.465 Mln
-689.0 Mille.
-11.2%
1 gen 2005 anni
2.79 Mln
-2.675 Mln
-48.95%
1 gen 2006 anni
4.726 Mln
+1.936 Mln
69.39%
1 gen 2007 anni
6.478 Mln
+1.752 Mln
37.07%
1 gen 2008 anni
12.337 Mln
+5.859 Mln
90.44%
1 gen 2009 anni
622.0 Mille.
-11.715 Mln
-94.96%
1 gen 2010 anni
445.0 Mille.
-177.0 Mille.
-28.46%
1 gen 2011 anni
352.0 Mille.
-93.0 Mille.
-20.9%
1 gen 2012 anni
357.0 Mille.
+5.0 Mille.
1.42%
1 gen 2013 anni
295.0 Mille.
-62.0 Mille.
-17.37%
1 gen 2014 anni
250.0 Mille.
-45.0 Mille.
-15.25%
1 gen 2015 anni
239.0 Mille.
-11.0 Mille.
-4.4%
Classificazione dei paesi secondo i statistiche attuali per anni