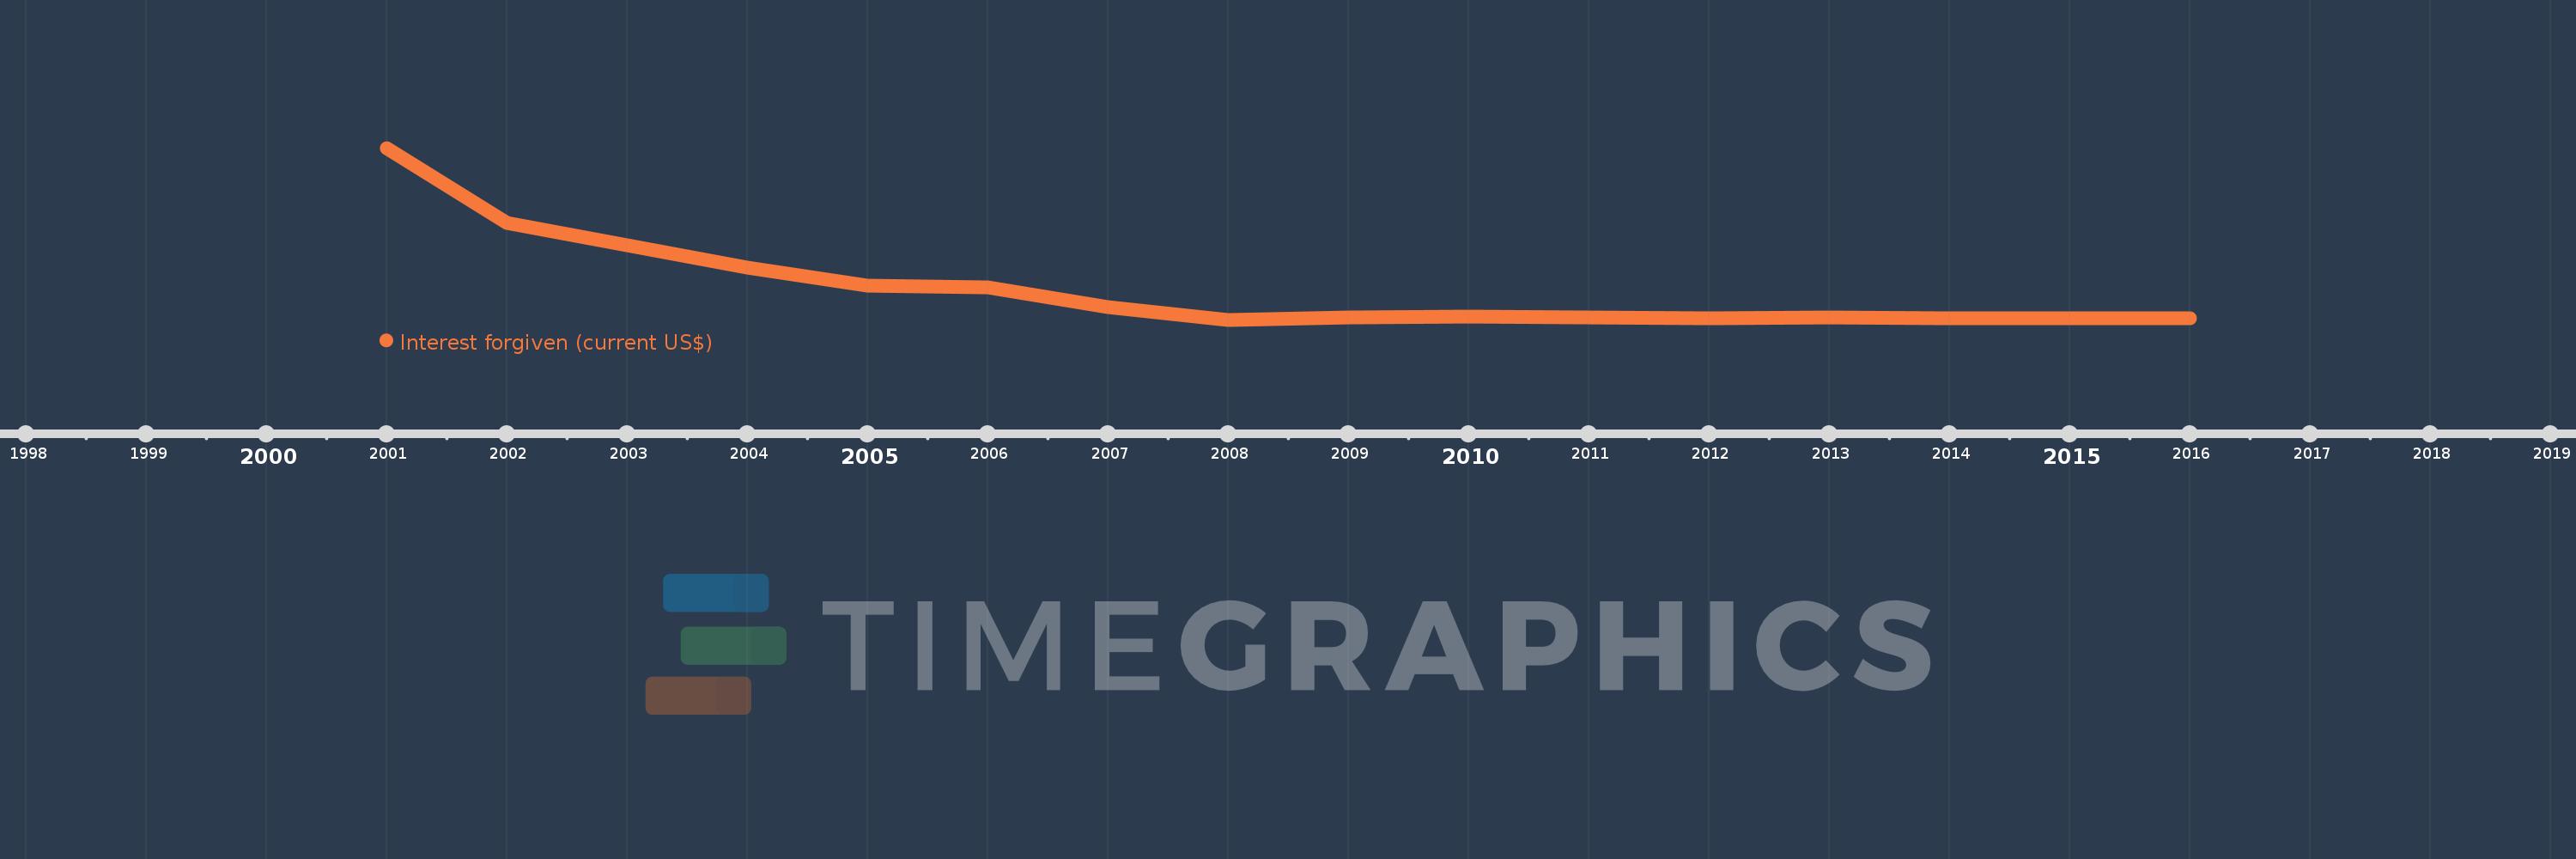
Questa scala temporale mostra un grafico dal 2001 anno al 2016 anno. Sao Tome and Principe. I dati fino ad 2000 anno non disponibili. Il numero di osservazioni attuali secondo i date: 16.
La fonte (nome):
Indicatori dello sviluppo mondiale
La fonte (organizzazione):
World Bank, International Debt Statistics.
Categorie:
External Debt
sono stati aggiornati
23 apr 2017 anni
Indicatori delle variazioni dei valori per anni
In media:
319.313 Mille.
Minima:
11.0 Mille.
1 gen 2008 anni
Massimo:
1.743 Mln
1 gen 2001 anni
Alla data di osservazione
Valore
Variazione assoluta
La variazione rispetto al valore precedente
1 gen 2001 anni
1.743 Mln
+1.743 Mln
0.0%
1 gen 2002 anni
987.0 Mille.
-756.0 Mille.
-43.37%
1 gen 2003 anni
765.0 Mille.
-222.0 Mille.
-22.49%
1 gen 2004 anni
535.0 Mille.
-230.0 Mille.
-30.07%
1 gen 2005 anni
351.0 Mille.
-184.0 Mille.
-34.39%
1 gen 2006 anni
337.0 Mille.
-14.0 Mille.
-3.99%
1 gen 2007 anni
136.0 Mille.
-201.0 Mille.
-59.64%
1 gen 2008 anni
11.0 Mille.
-125.0 Mille.
-91.91%
1 gen 2009 anni
36.0 Mille.
+25.0 Mille.
227.27%
1 gen 2010 anni
40.0 Mille.
+4.0 Mille.
11.11%
1 gen 2011 anni
38.0 Mille.
-2.0 Mille.
-5.0%
1 gen 2012 anni
25.0 Mille.
-13.0 Mille.
-34.21%
1 gen 2013 anni
32.0 Mille.
+7.0 Mille.
28.0%
1 gen 2014 anni
24.0 Mille.
-8.0 Mille.
-25.0%
1 gen 2015 anni
27.0 Mille.
+3.0 Mille.
12.5%
1 gen 2016 anni
22.0 Mille.
-5.0 Mille.
-18.52%
Classificazione dei paesi secondo i statistiche attuali per anni