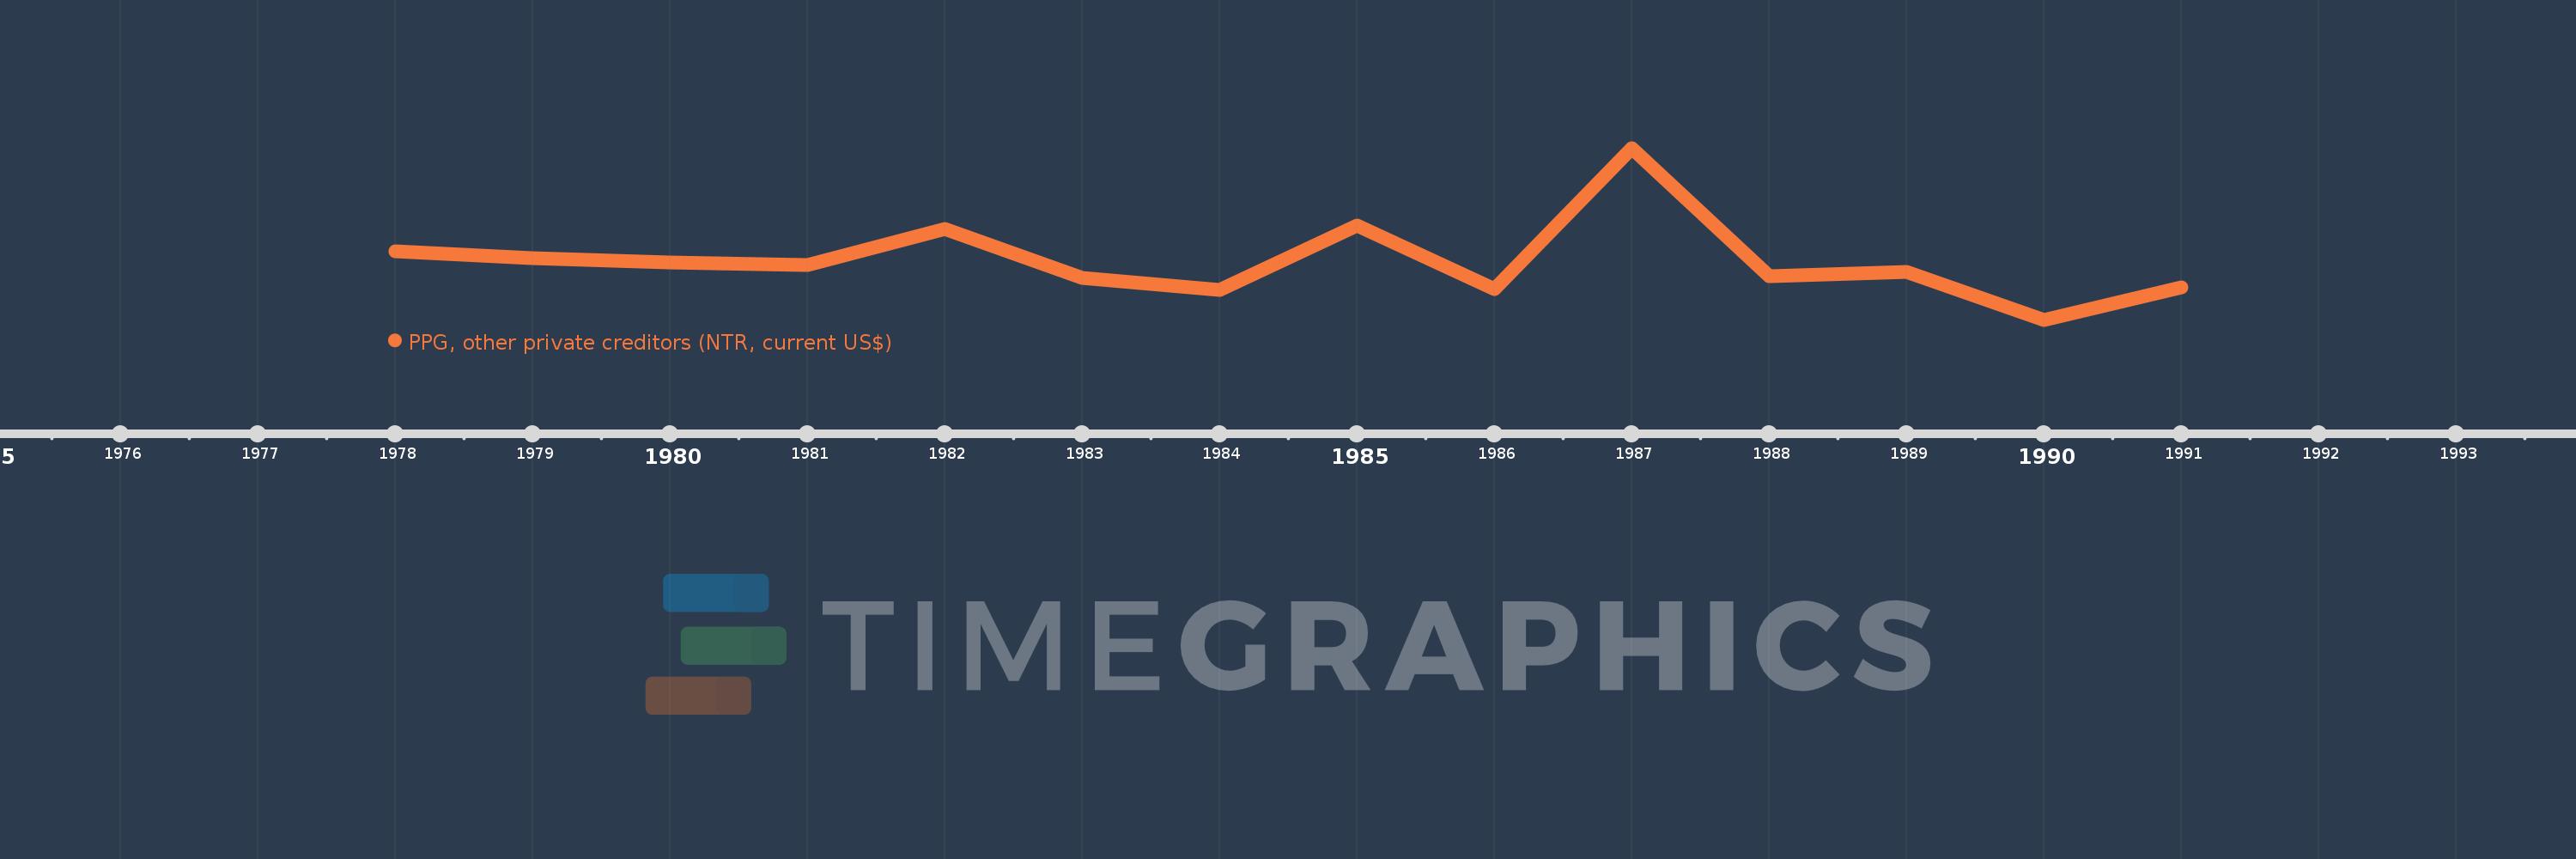
Questa scala temporale mostra un grafico dal 1978 anno al 1991 anno. Sao Tome and Principe. I dati fino ad 1977 anno non disponibili. Il numero di osservazioni attuali secondo i date: 14.
La fonte (nome):
Indicatori dello sviluppo mondiale
La fonte (organizzazione):
World Bank, International Debt Statistics.
Categorie:
External Debt
sono stati aggiornati
23 apr 2017 anni
Indicatori delle variazioni dei valori per anni
In media:
66.214 Mille.
Minima:
-471.0 Mille.
1 gen 1990 anni
Massimo:
1.096 Mln
1 gen 1987 anni
Alla data di osservazione
Valore
Variazione assoluta
La variazione rispetto al valore precedente
1 gen 1978 anni
154.0 Mille.
+154.0 Mille.
0.0%
1 gen 1979 anni
88.0 Mille.
-66.0 Mille.
-42.86%
1 gen 1980 anni
50.0 Mille.
-38.0 Mille.
-43.18%
1 gen 1981 anni
26.0 Mille.
-24.0 Mille.
-48.0%
1 gen 1982 anni
355.0 Mille.
+329.0 Mille.
1.27 Mille.%
1 gen 1983 anni
-88.0 Mille.
-443.0 Mille.
-124.79%
1 gen 1984 anni
-201.0 Mille.
-113.0 Mille.
128.41%
1 gen 1985 anni
389.0 Mille.
+590.0 Mille.
-293.53%
1 gen 1986 anni
-192.0 Mille.
-581.0 Mille.
-149.36%
1 gen 1987 anni
1.096 Mln
+1.288 Mln
-670.83%
1 gen 1988 anni
-70.0 Mille.
-1.166 Mln
-106.39%
1 gen 1989 anni
-35.0 Mille.
+35.0 Mille.
-50.0%
1 gen 1990 anni
-471.0 Mille.
-436.0 Mille.
1.25 Mille.%
1 gen 1991 anni
-174.0 Mille.
+297.0 Mille.
-63.06%
Classificazione dei paesi secondo i statistiche attuali per anni