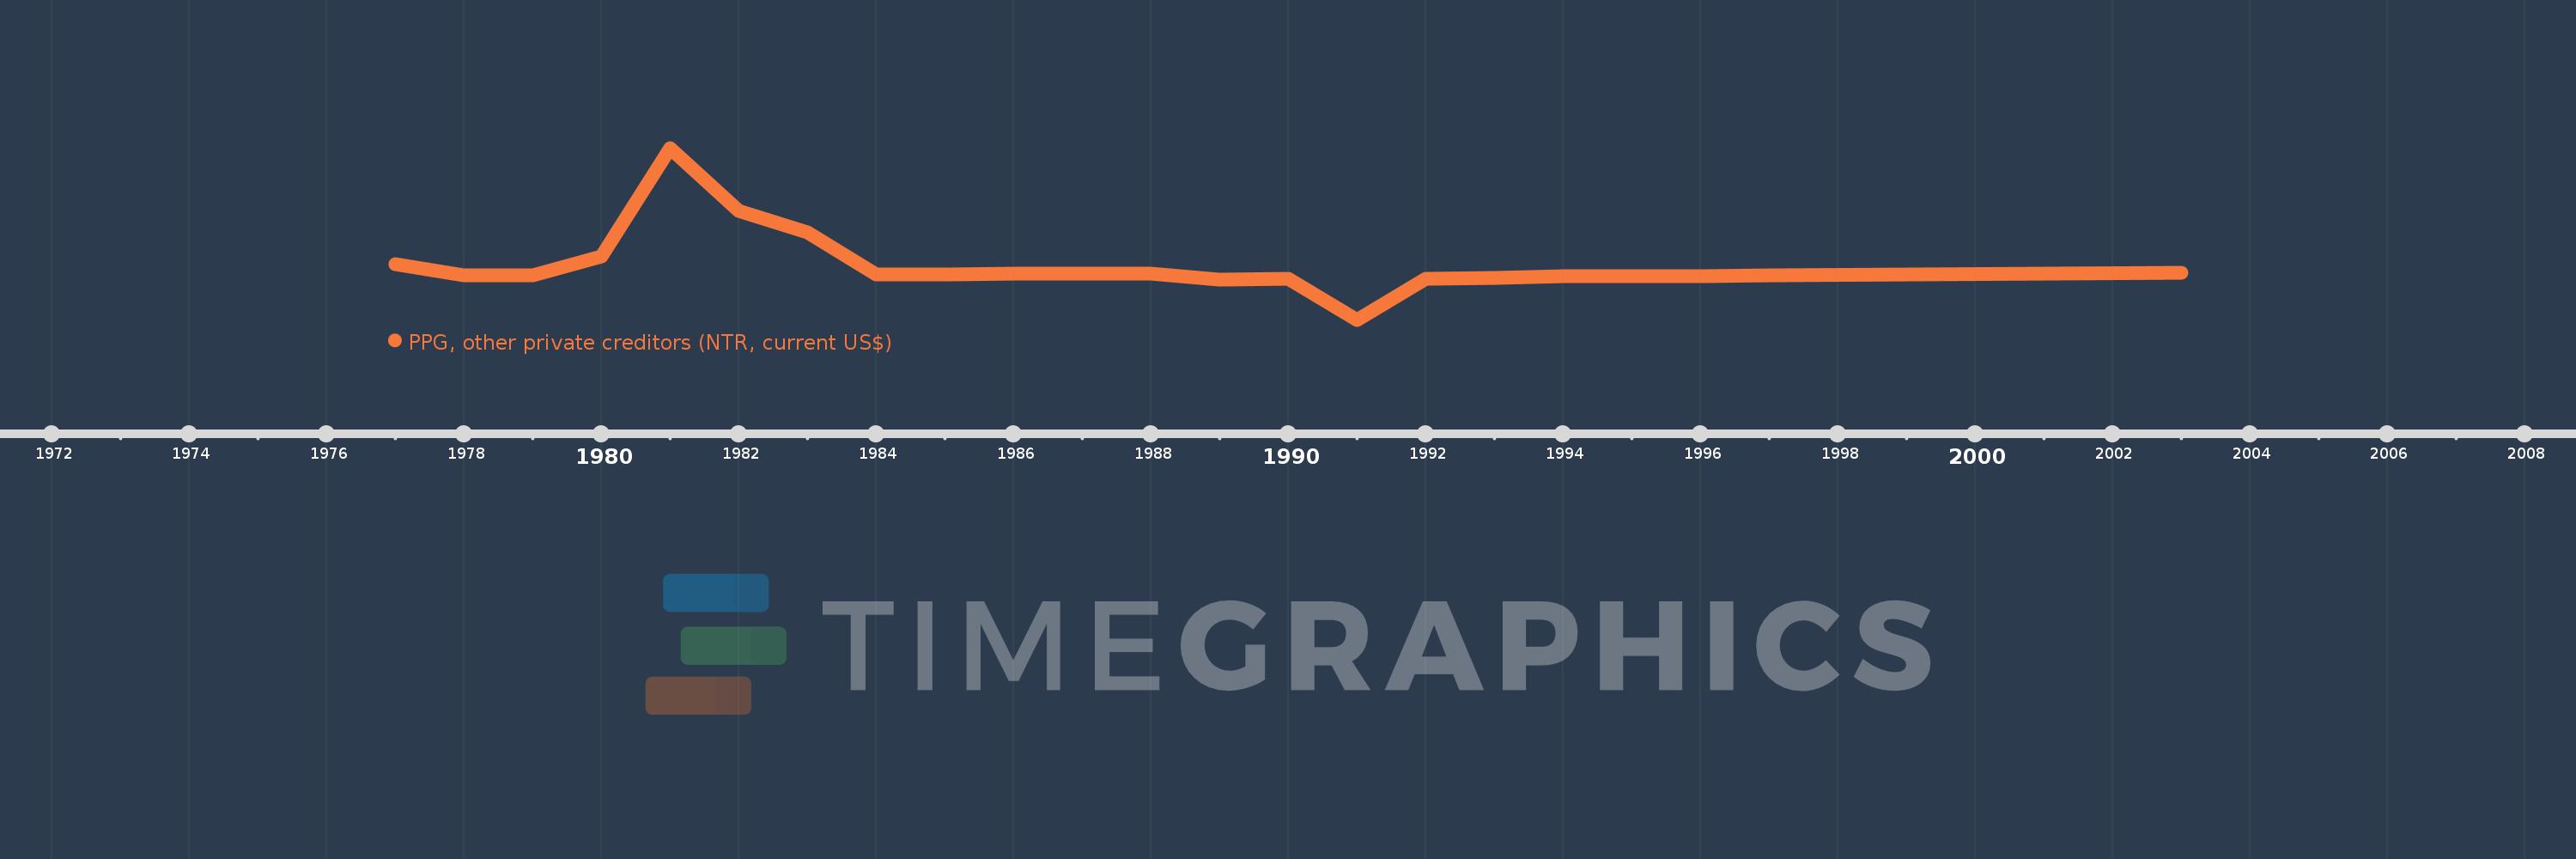
Questa scala temporale mostra un grafico dal 1977 anno al 2003 anno. Gambia, The. I dati fino ad 1976 anno non disponibili. Il numero di osservazioni attuali secondo i date: 22.
La fonte (nome):
Indicatori dello sviluppo mondiale
La fonte (organizzazione):
World Bank, International Debt Statistics.
Categorie:
External Debt
sono stati aggiornati
23 apr 2017 anni
Indicatori delle variazioni dei valori per anni
In media:
846.318 Mille.
Minima:
-5.361 Mln
1 gen 1991 anni
Massimo:
14.355 Mln
1 gen 1981 anni
Alla data di osservazione
Valore
Variazione assoluta
La variazione rispetto al valore precedente
1 gen 1977 anni
1.063 Mln
+1.063 Mln
0.0%
1 gen 1978 anni
-290.0 Mille.
-1.353 Mln
-127.28%
1 gen 1979 anni
-274.0 Mille.
+16.0 Mille.
-5.52%
1 gen 1980 anni
1.86 Mln
+2.134 Mln
-778.83%
1 gen 1981 anni
14.355 Mln
+12.495 Mln
671.77%
1 gen 1982 anni
7.098 Mln
-7.257 Mln
-50.55%
1 gen 1983 anni
4.618 Mln
-2.48 Mln
-34.94%
1 gen 1984 anni
-139.0 Mille.
-4.757 Mln
-103.01%
1 gen 1985 anni
-132.0 Mille.
+7.0 Mille.
-5.04%
1 gen 1986 anni
-20.0 Mille.
+112.0 Mille.
-84.85%
1 gen 1988 anni
-110.0 Mille.
-90.0 Mille.
450.0%
1 gen 1989 anni
-753.0 Mille.
-643.0 Mille.
584.55%
1 gen 1990 anni
-674.0 Mille.
+79.0 Mille.
-10.49%
1 gen 1991 anni
-5.361 Mln
-4.687 Mln
695.4%
1 gen 1992 anni
-673.0 Mille.
+4.688 Mln
-87.45%
1 gen 1993 anni
-556.0 Mille.
+117.0 Mille.
-17.38%
1 gen 1994 anni
-351.0 Mille.
+205.0 Mille.
-36.87%
1 gen 1995 anni
-360.0 Mille.
-9.0 Mille.
2.56%
1 gen 1996 anni
-393.0 Mille.
-33.0 Mille.
9.17%
1 gen 1997 anni
-237.0 Mille.
+156.0 Mille.
-39.69%
1 gen 2001 anni
-48.0 Mille.
+189.0 Mille.
-79.75%
1 gen 2003 anni
-4.0 Mille.
+44.0 Mille.
-91.67%
Classificazione dei paesi secondo i statistiche attuali per anni