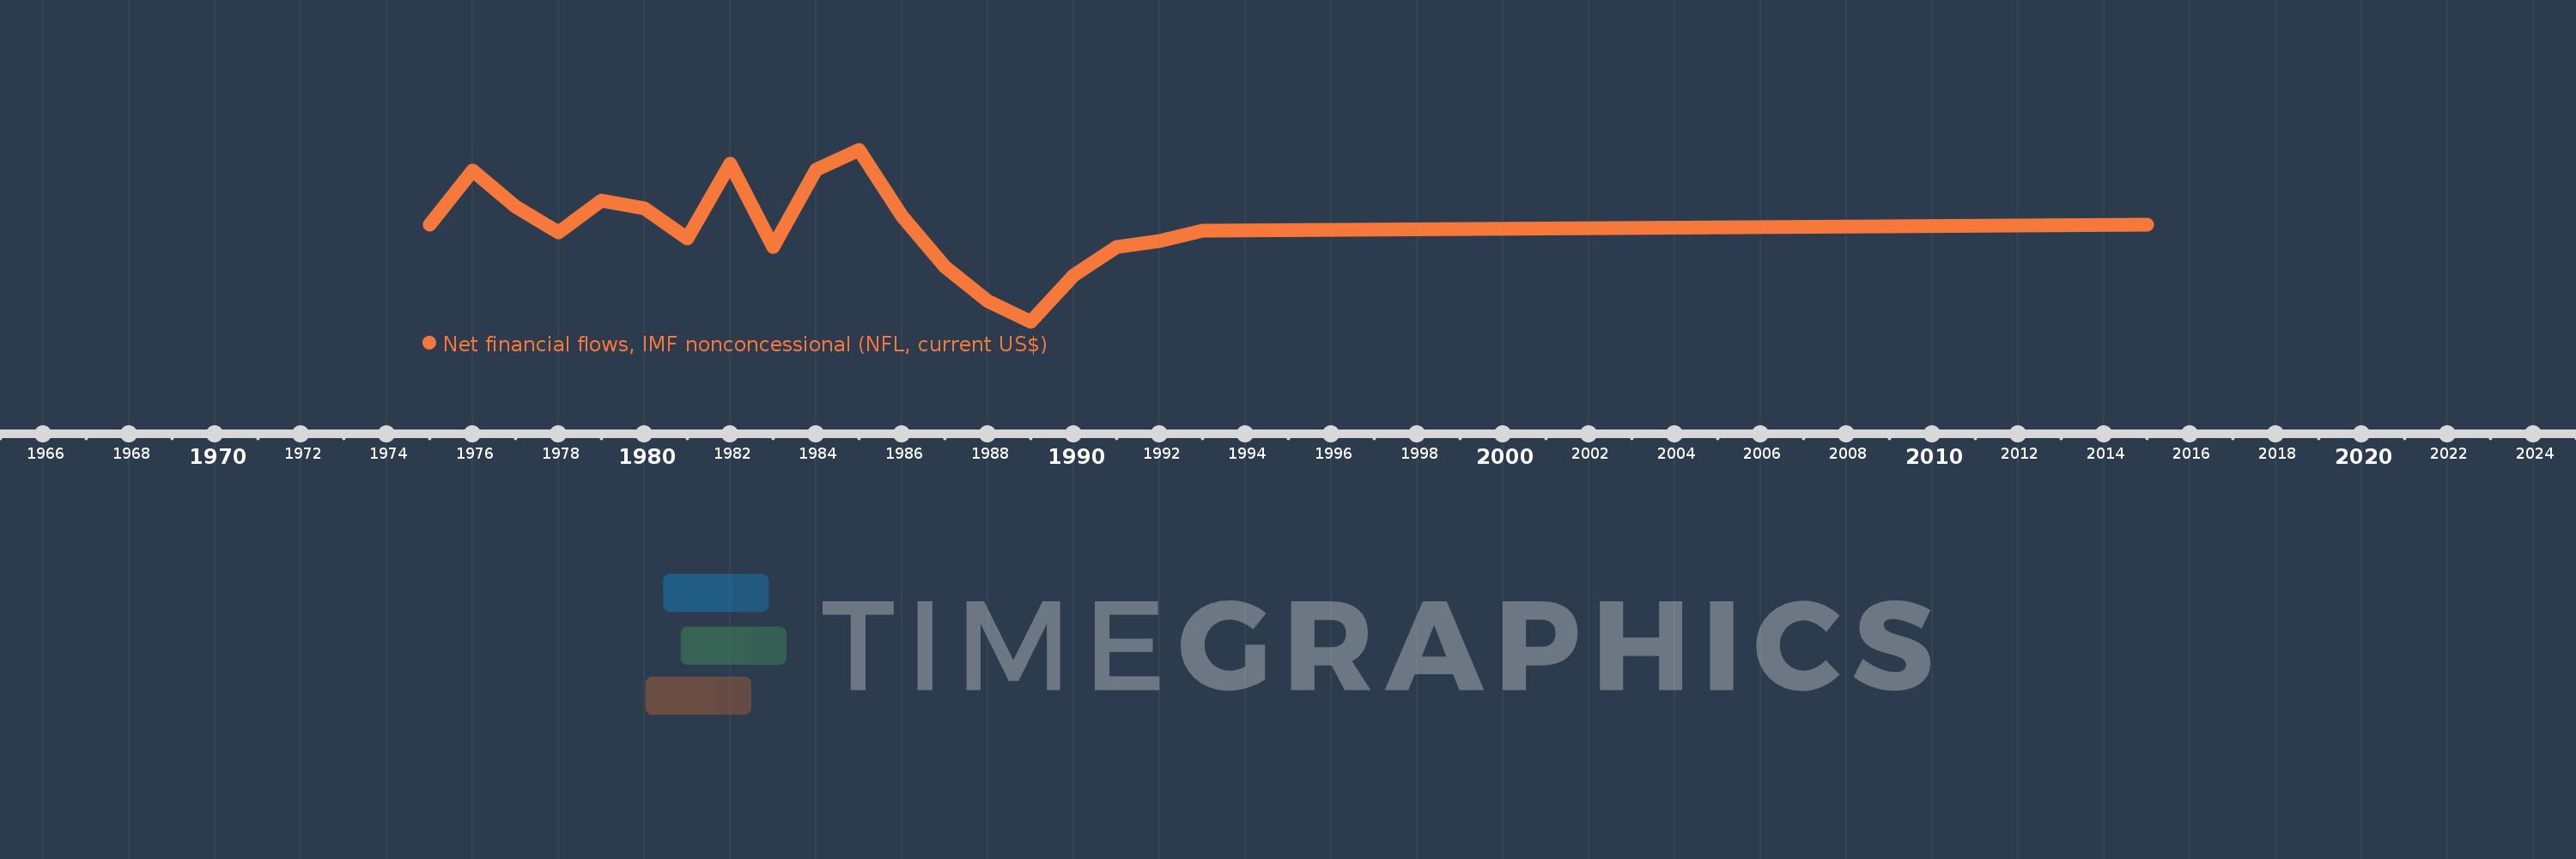
Questa scala temporale mostra un grafico dal 1975 anno al 2015 anno. Samoa. I dati fino ad 1974 anno non disponibili. Il numero di osservazioni attuali secondo i date: 20.
La fonte (nome):
Indicatori dello sviluppo mondiale
La fonte (organizzazione):
World Bank, International Debt Statistics.
Categorie:
External Debt
sono stati aggiornati
23 apr 2017 anni
Indicatori delle variazioni dei valori per anni
In media:
-71.7 Mille.
Minima:
-3.506 Mln
1 gen 1989 anni
Massimo:
2.7 Mln
1 gen 1985 anni
Alla data di osservazione
Valore
Variazione assoluta
La variazione rispetto al valore precedente
1 gen 1975 anni
0.0
0.0
0.0%
1 gen 1976 anni
1.967 Mln
+1.967 Mln
%
1 gen 1977 anni
660.0 Mille.
-1.307 Mln
-66.45%
1 gen 1978 anni
-280.0 Mille.
-940.0 Mille.
-142.42%
1 gen 1979 anni
874.0 Mille.
+1.154 Mln
-412.14%
1 gen 1980 anni
610.0 Mille.
-264.0 Mille.
-30.21%
1 gen 1981 anni
-500.0 Mille.
-1.11 Mln
-181.97%
1 gen 1982 anni
2.2 Mln
+2.7 Mln
-540.0%
1 gen 1983 anni
-800.0 Mille.
-3.0 Mln
-136.36%
1 gen 1984 anni
2.0 Mln
+2.8 Mln
-350.0%
1 gen 1985 anni
2.7 Mln
+700.0 Mille.
35.0%
1 gen 1986 anni
320.0 Mille.
-2.38 Mln
-88.15%
1 gen 1987 anni
-1.51 Mln
-1.83 Mln
-571.88%
1 gen 1988 anni
-2.757 Mln
-1.247 Mln
82.58%
1 gen 1989 anni
-3.506 Mln
-749.0 Mille.
27.17%
1 gen 1990 anni
-1.824 Mln
+1.682 Mln
-47.97%
1 gen 1991 anni
-787.0 Mille.
+1.037 Mln
-56.85%
1 gen 1992 anni
-578.0 Mille.
+209.0 Mille.
-26.56%
1 gen 1993 anni
-223.0 Mille.
+355.0 Mille.
-61.42%
1 gen 2015 anni
0.0
+223.0 Mille.
-100.0%
Classificazione dei paesi secondo i statistiche attuali per anni