33
/it/
AIzaSyB4mHJ5NPEv-XzF7P6NDYXjlkCWaeKw5bc
November 30, 2025
179204
Liberia
LBR
true
2
1
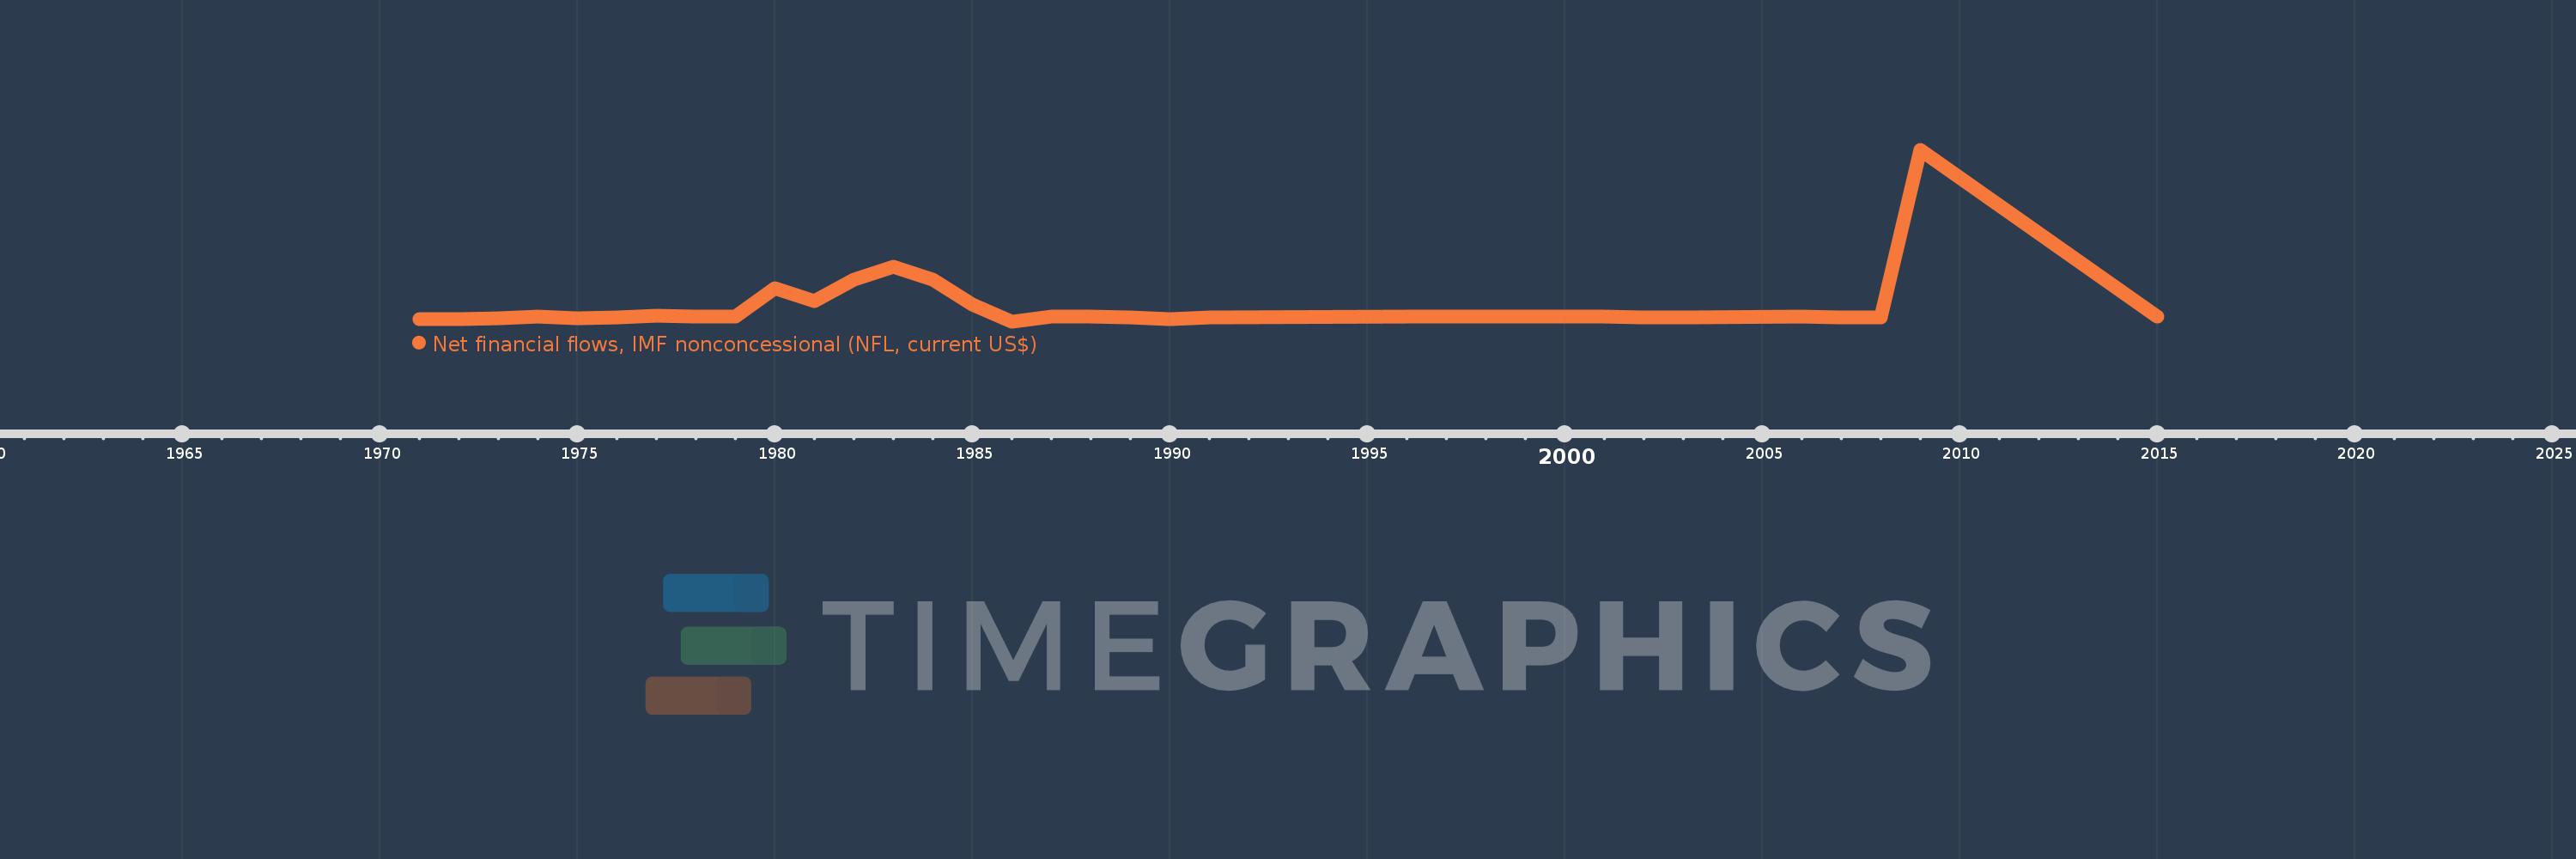
Net financial flows, IMF nonconcessional (NFL, current US$)
2015,2009,2008,2007,2006,2003,2002,2001,1996,1991,1990,1989,1988,1987,1986,1985,1984,1983,1982,1981,1980,1979,1978,1977,1976,1975,1974,1973,1972,1971