Download Queste statistiche in altri paesi:
Linea del tempo:
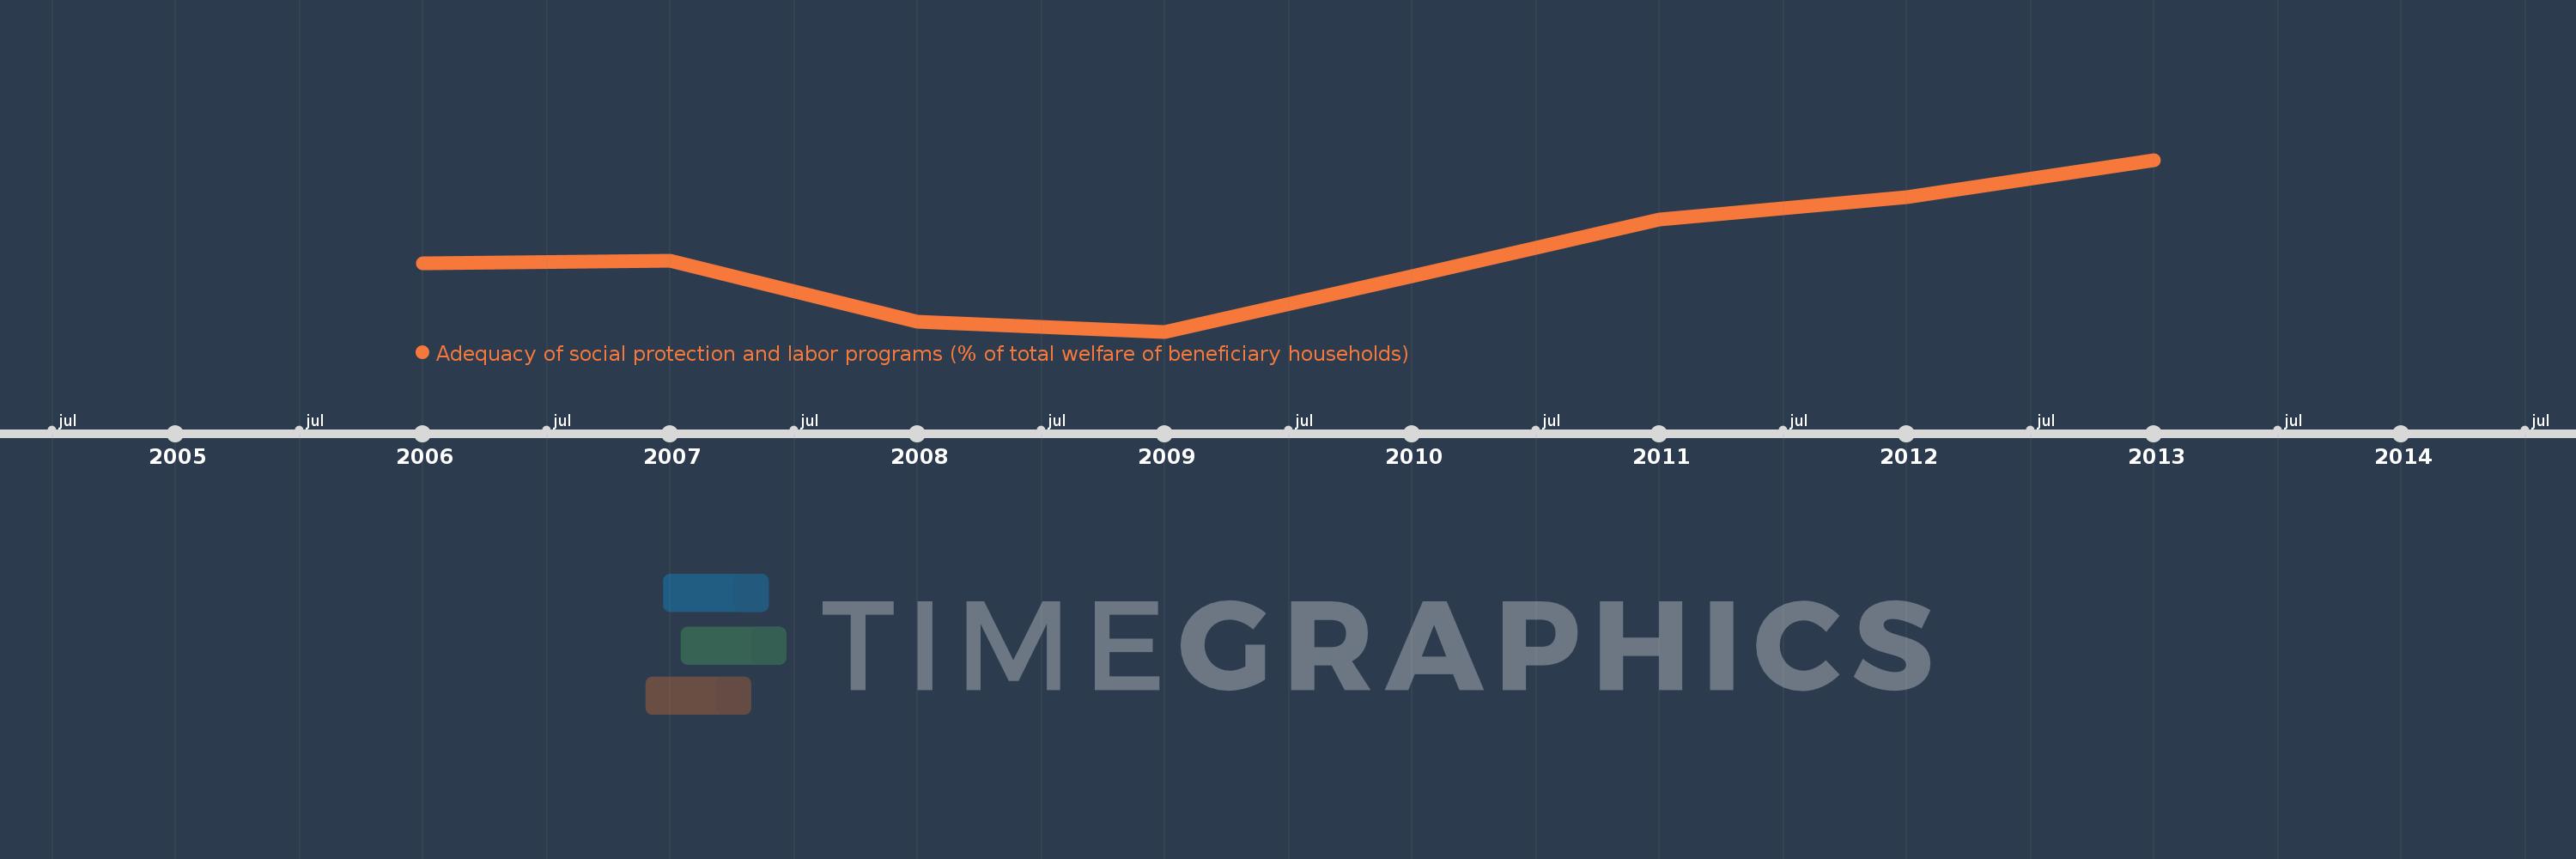
Questa scala temporale mostra un grafico dal 2006 anno al 2013 anno. Poland. I dati fino ad 2005 anno non disponibili. Il numero di osservazioni attuali secondo i date: 8.
La fonte (nome):
Indicatori dello sviluppo mondiale
La fonte (organizzazione):
The Atlas of Social Protection: Indicators of Resilience and Equity (ASPIRE)
Categorie:
Social Protection & Labor
sono stati aggiornati
23 apr 2017 anni
Indicatori delle variazioni dei valori per anni
Minima:
54.653
1 gen 2009 anni
Massimo:
60.555
1 gen 2013 anni
Alla data di osservazione
Valore
Variazione assoluta
La variazione rispetto al valore precedente
1 gen 2006 anni
56.986
+56.986
0.0%
1 gen 2007 anni
57.087
+0.101
0.18%
1 gen 2008 anni
54.999
-2.087
-3.66%
1 gen 2009 anni
54.653
-0.346
-0.63%
1 gen 2010 anni
56.565
+1.912
3.5%
1 gen 2011 anni
58.51
+1.945
3.44%
1 gen 2012 anni
59.282
+0.773
1.32%
1 gen 2013 anni
60.555
+1.273
2.15%
Classificazione dei paesi secondo i statistiche attuali per anni