Download Queste statistiche in altri paesi:
Linea del tempo:
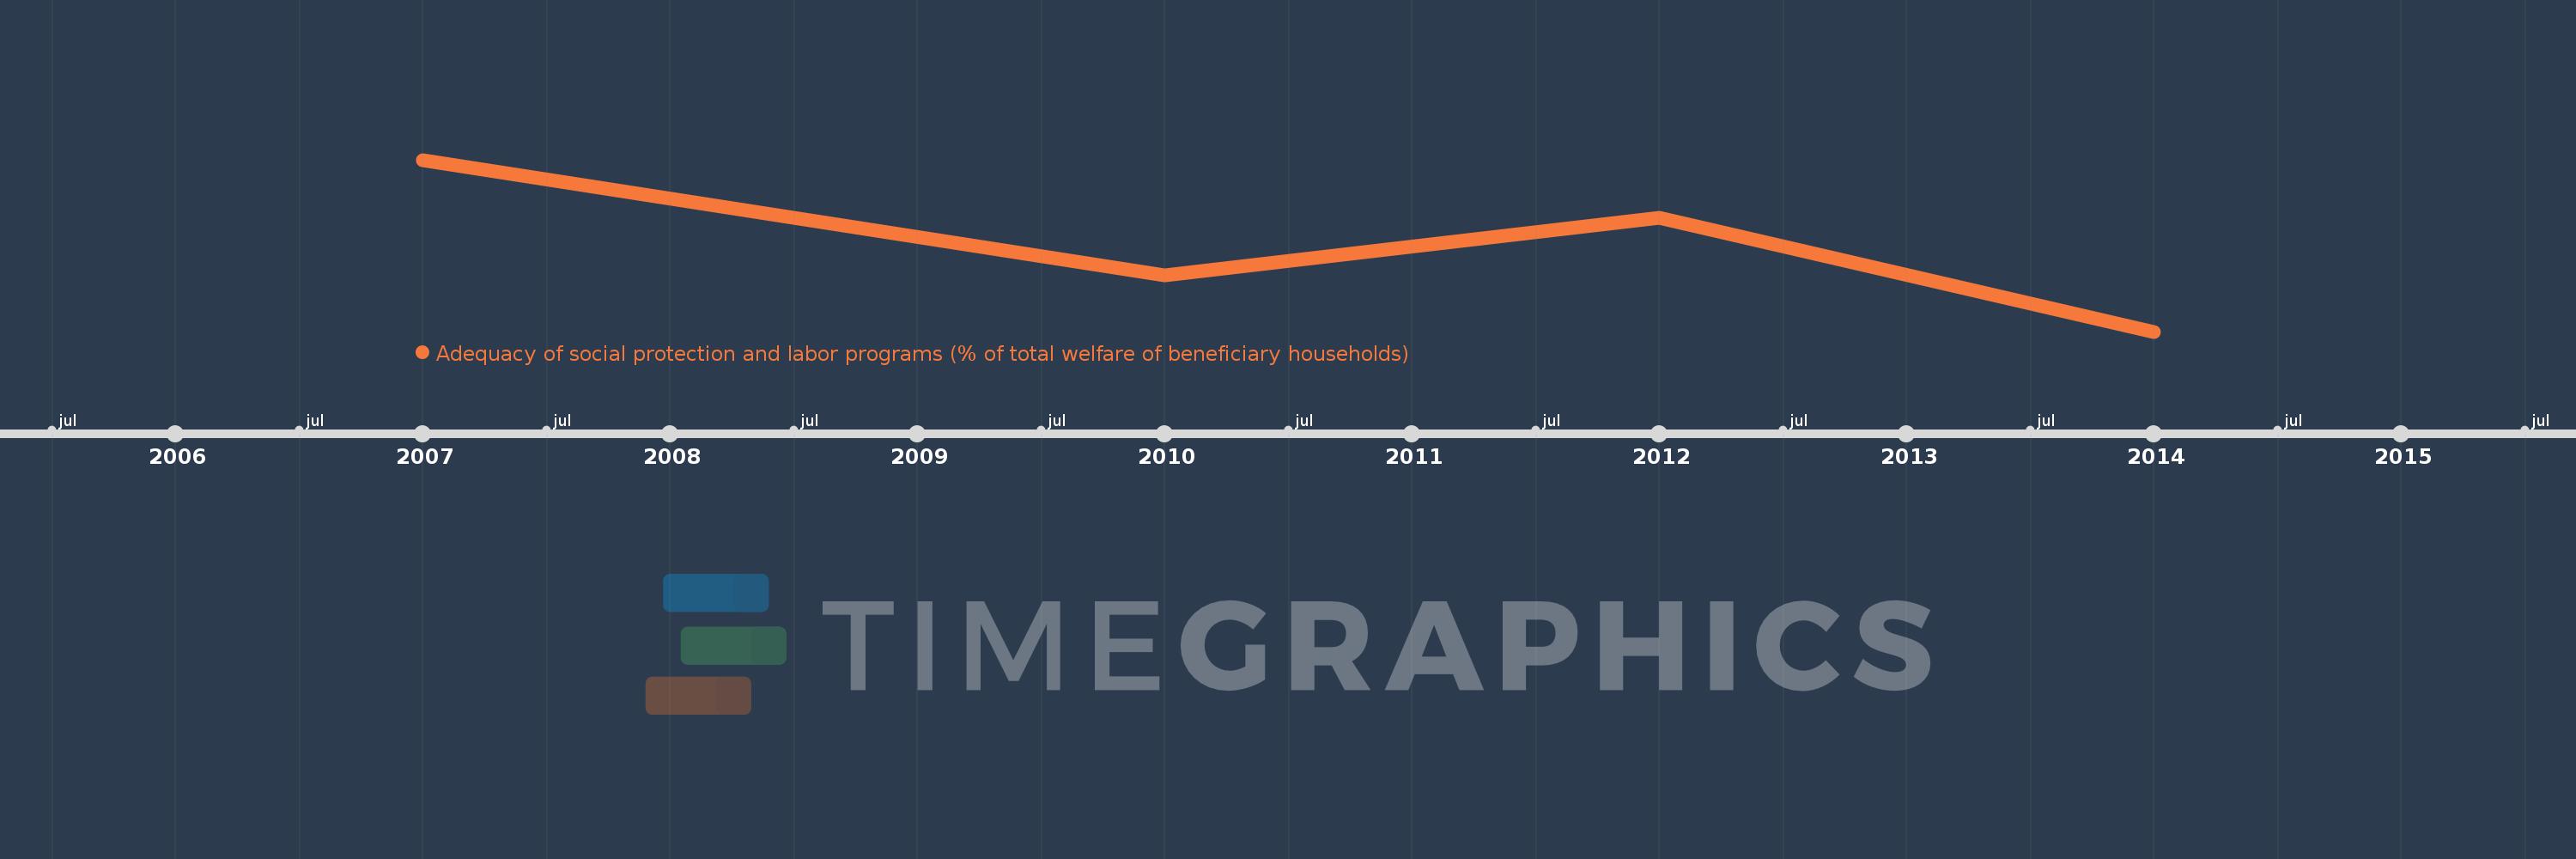
Questa scala temporale mostra un grafico dal 2007 anno al 2014 anno. Chile. I dati fino ad 2006 anno non disponibili. Il numero di osservazioni attuali secondo i date: 4.
La fonte (nome):
Indicatori dello sviluppo mondiale
La fonte (organizzazione):
The Atlas of Social Protection: Indicators of Resilience and Equity (ASPIRE)
Categorie:
Social Protection & Labor
sono stati aggiornati
23 apr 2017 anni
Indicatori delle variazioni dei valori per anni
Minima:
16.961
1 gen 2014 anni
Massimo:
18.721
1 gen 2007 anni
Alla data di osservazione
Valore
Variazione assoluta
La variazione rispetto al valore precedente
1 gen 2007 anni
18.721
+18.721
0.0%
1 gen 2010 anni
17.538
-1.183
-6.32%
1 gen 2012 anni
18.124
+0.586
3.34%
1 gen 2014 anni
16.961
-1.163
-6.42%
Classificazione dei paesi secondo i statistiche attuali per anni